SmileDirectClub Investor Presentation Deck
Marketing & selling.
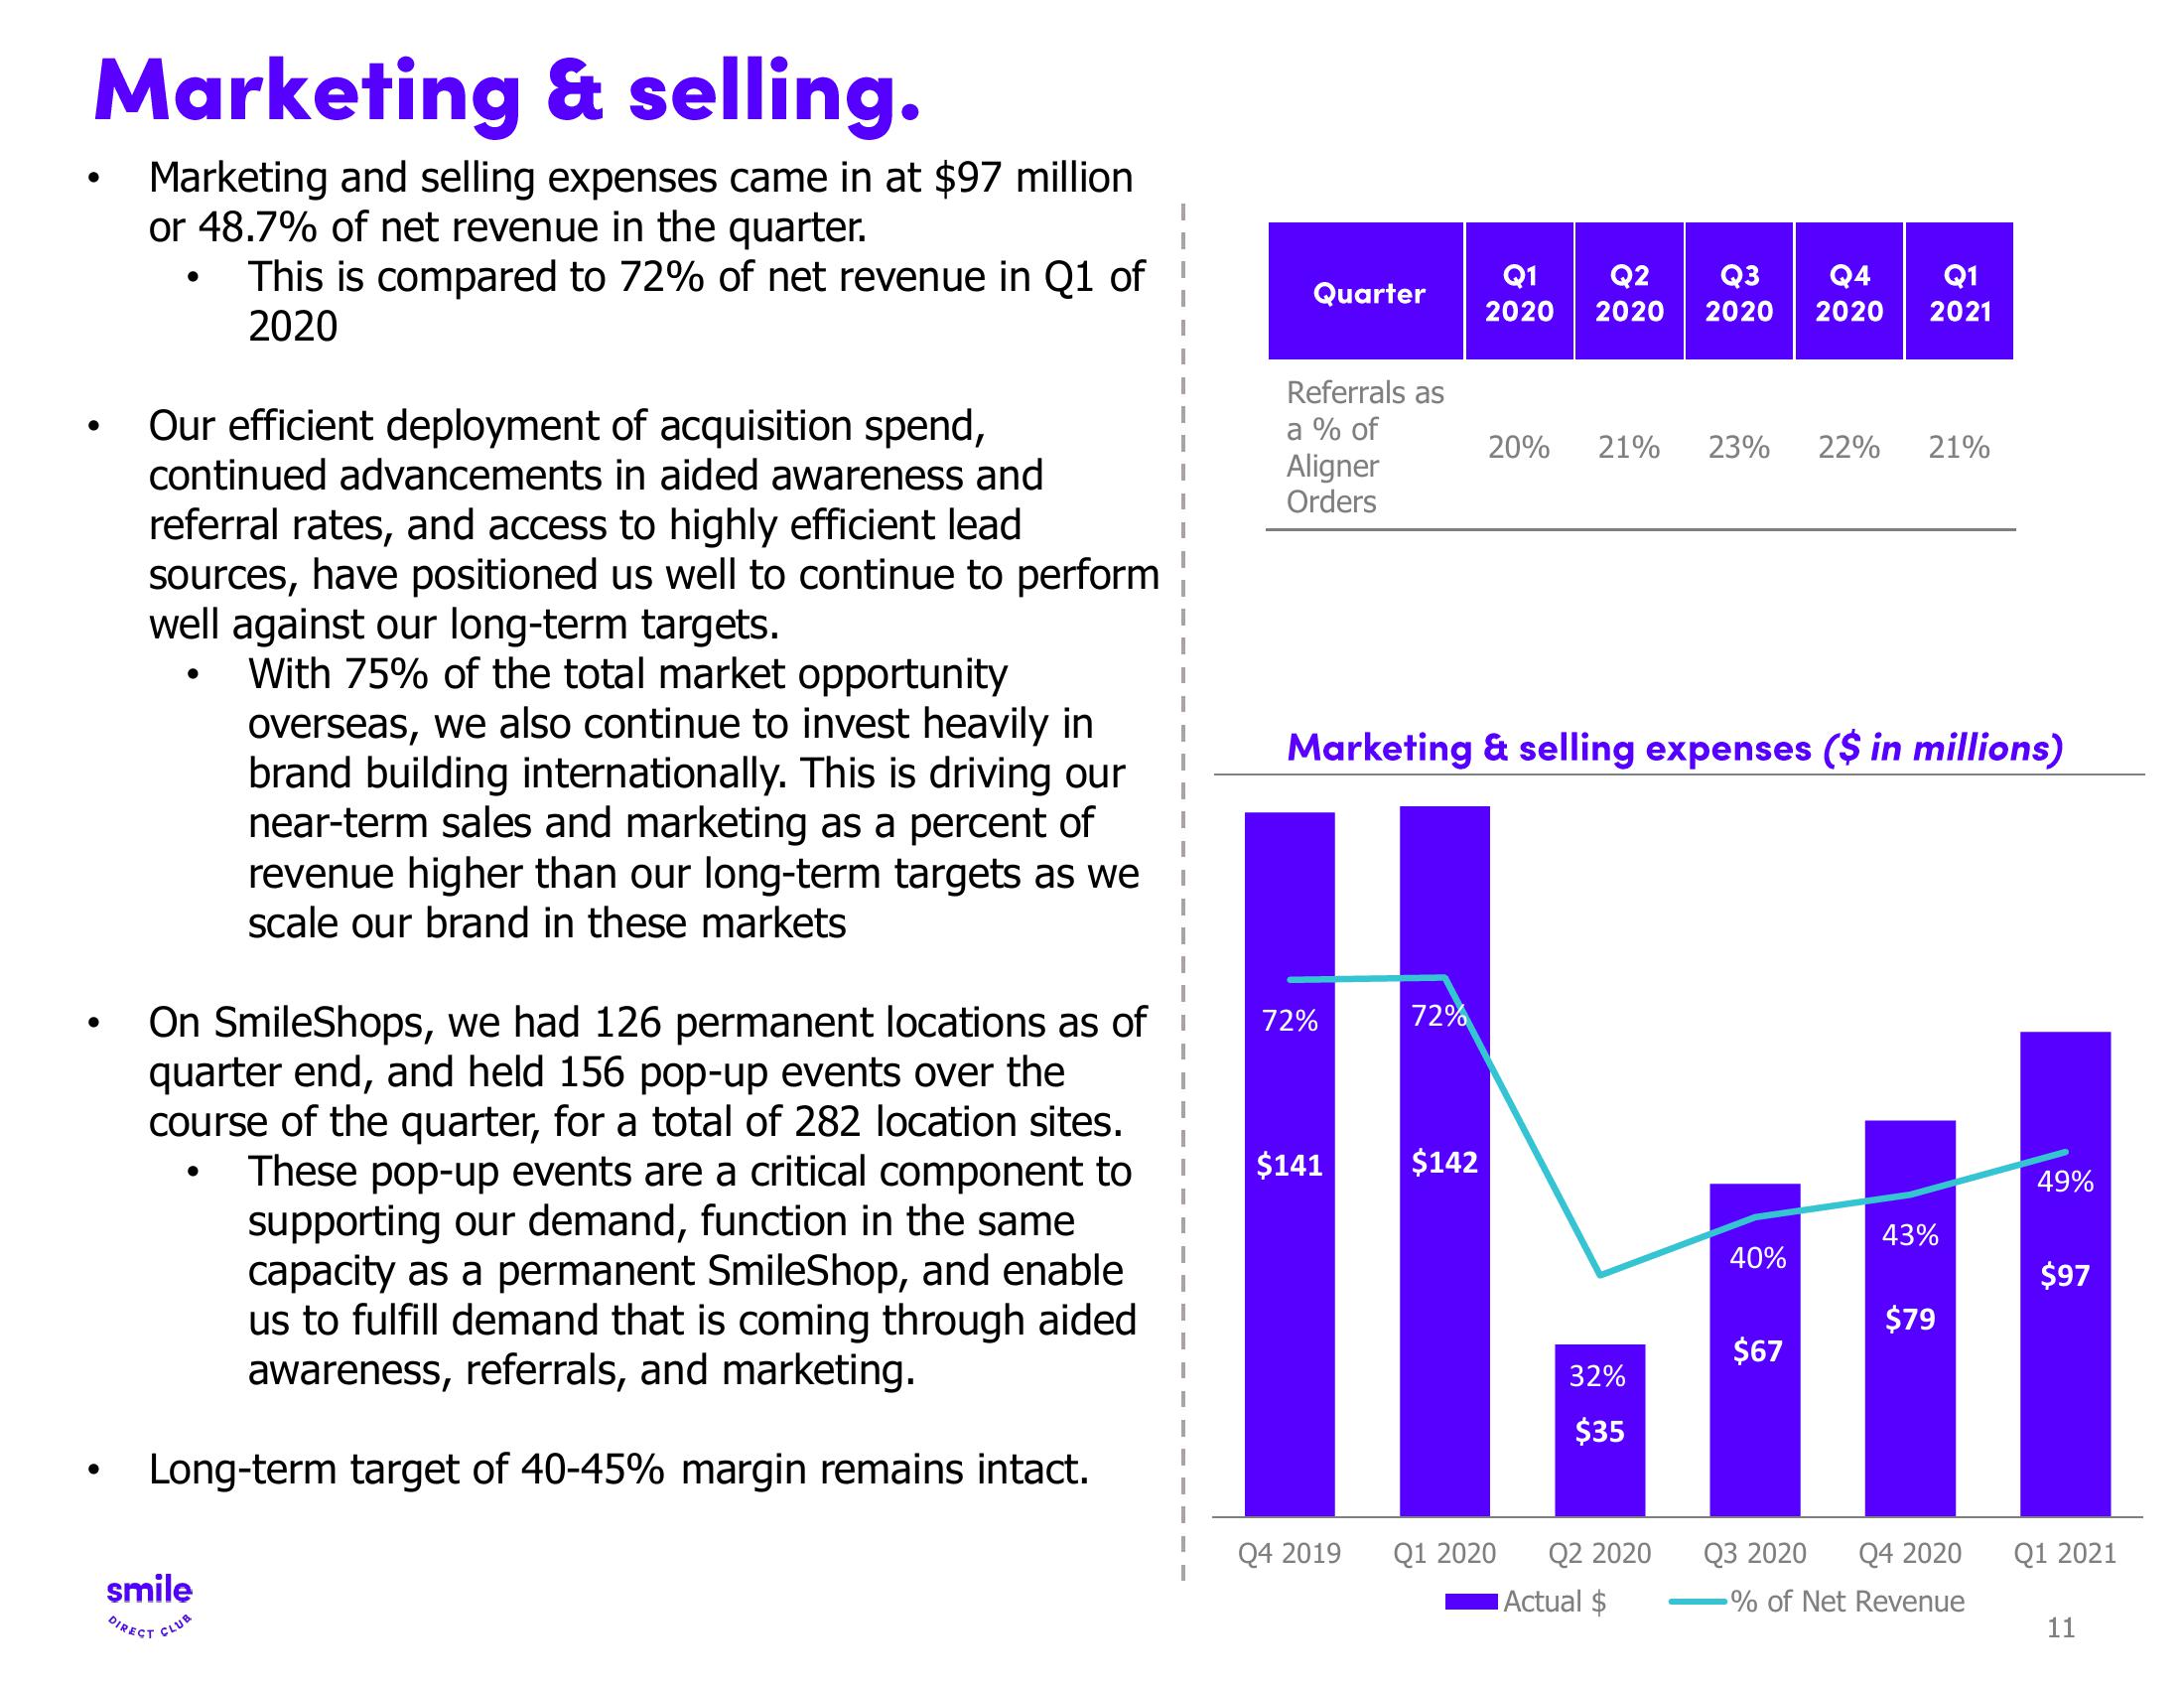
Marketing and selling expenses came in at $97 million
or 48.7% of net revenue in the quarter.
●
●
Our efficient deployment of acquisition spend,
continued advancements in aided awareness and
referral rates, and access to highly efficient lead
sources, have positioned us well to continue to perform
well against our long-term targets.
With 75% of the total market opportunity
overseas, we also continue to invest heavily in
brand building internationally. This is driving our
near-term sales and marketing as a percent of
revenue higher than our long-term targets as we
scale our brand in these markets
●
This is compared to 72% of net revenue in Q1 of
2020
On SmileShops, we had 126 permanent locations as of
quarter end, and held 156 pop-up events over the
course of the quarter, for a total of 282 location sites.
These pop-up events are a critical component to
supporting our demand, function in the same
capacity as a permanent SmileShop, and enable
us to fulfill demand that is coming through aided
awareness, referrals, and marketing.
Long-term target of 40-45% margin remains intact.
smile
DIRECT CLUB
Quarter
Referrals as
a % of
Aligner
Orders
72%
$141
Marketing & selling expenses ($ in millions)
Q4 2019
72%
Q1 Q2 Q3 Q4
2020 2020 2020 2020
$142
20% 21% 23% 22% 21%
Q1 2020
32%
$35
Q2 2020
Actual $
40%
Q1
2021
$67
Q3 2020
43%
$79
Q4 2020
% of Net Revenue
49%
$97
Q1 2021
11View entire presentation