Baird Investment Banking Pitch Book
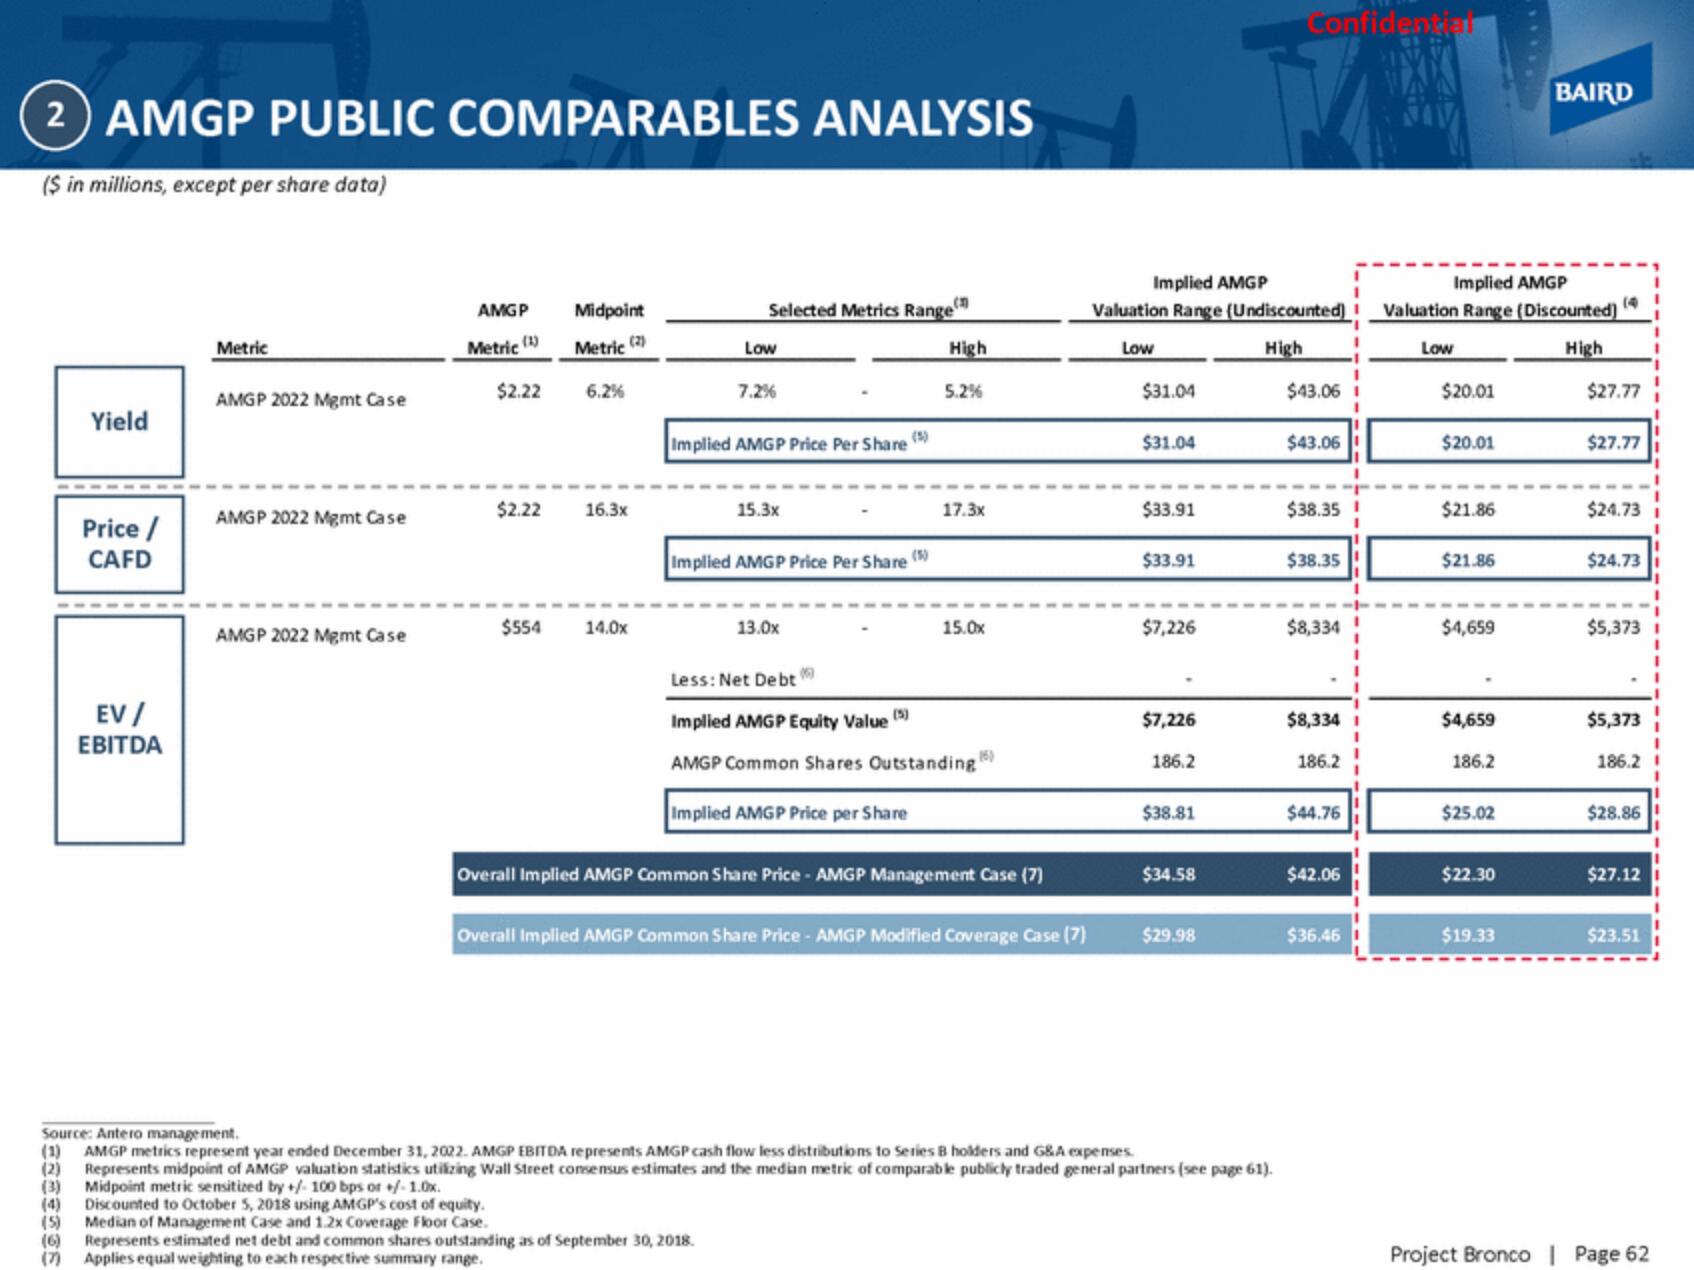
2 AMGP PUBLIC COMPARABLES ANALYSIS
($ in millions, except per share data)
Yield
Price /
CAFD
EV/
EBITDA
Metric
AMGP 2022 Mgmt Case
AMGP 2022 Mgmt Case
AMGP 2022 Mgmt Case
AMGP
Metric (1)
$2.22
$2.22
Midpoint
Metric (2)
6.2%
16.3x
$554 14.0x
Selected Metrics Range
Low
7.2%
Implied AMGP Price Per Share
15.3x
(5)
Implied AMGP Price Per Share (5)
13.0x
High
5.2%
17.3x
15.0x
Less: Net Debt
Implied AMGP Equity Value (5)
AMGP Common Shares Outstanding (5)
Implied AMGP Price per Share
Overall Implied AMGP Common Share Price - AMGP Management Case (7)
Overall Implied AMGP Common Share Price - AMGP Modified Coverage Case (7)
Implied AMGP
Valuation Range (Undiscounted)
High
Low
$31.04
$31.04
$33.91
$33.91
$7,226
$7,226
186.2
$38.81
$34.58
$29.98
Confidential
Source: Antero management.
(1) AMGP metrics represent year ended December 31, 2022. AMGP EBITDA represents AMGP cash flow less distributions to Series 8 holders and G&A expenses.
(2)
Represents midpoint of AMGP valuation statistics utilizing Wall Street consensus estimates and the median metric of comparable publicly traded general partners (see page 61).
Midpoint metric sensitized by +/- 100 bps or +/-1.0x.
(3)
(4) Discounted to October 5, 2018 using AMGP's cost of equity.
(5) Median of Management Case and 1.2x Coverage Floor Case.
(6) Represents estimated net debt and common shares outstanding as of September 30, 2018.
(7)
Applies equal weighting to each respective summary range.
$43.06
$43.06
$38.35
$38.35
$8,334
$8,334
186.2
$44.76
$42.06
$36.46
Implied AMGP
Valuation Range (Discounted)
Low
High
$20.01
$20.01
$21.86
$21.86
$4,659
$4,659
186.2
$25.02
$22.30
BAIRD
$19.33
(4
$27.77
$27.77
$24.73
$24.73
$5,373
$5,373
186.2
$28.86
$27.12
$23.51
Project Bronco | Page 62View entire presentation