XP Inc Results Presentation Deck
Non-GAAP Financial Information
Normalized Effective Tax Rate reconciliation
(in R$ mn)
Managerial Income Statement
Total Gross Revenue
Net Revenue
COGS
SG&A
Share Based Compensation¹
Adjusted EBITDA
Adjusted EBITDA Margin
D&A
Interest expense on debt
Share of profit or (loss) in joint ventures and associates
Taxable equivalent adjustments²
EBT (Taxable equivalent)
Tax expense (Normalized)
Effective tax rate (Normalized)
Adjusted Net Income
Adjusted Net Margin
4Q21
3,447
3,260
(896)
(989)
(133)
1,390
42.7%
(52)
(57)
(11)
157
1,278
(287)
(22.5%)
1,086
33.3%
4Q20
2,570
2,395
(836)
(717)
(136)
891
37.2%
(37)
(6)
1
163
826
(224)
(27.1%)
721
30.1%
YoY
34%
36%
7%
38%
-2%
56%
5.5 p.p
40%
809%
-879%
-4%
55%
28%
4.6 p.p
51%
3.2 p.p
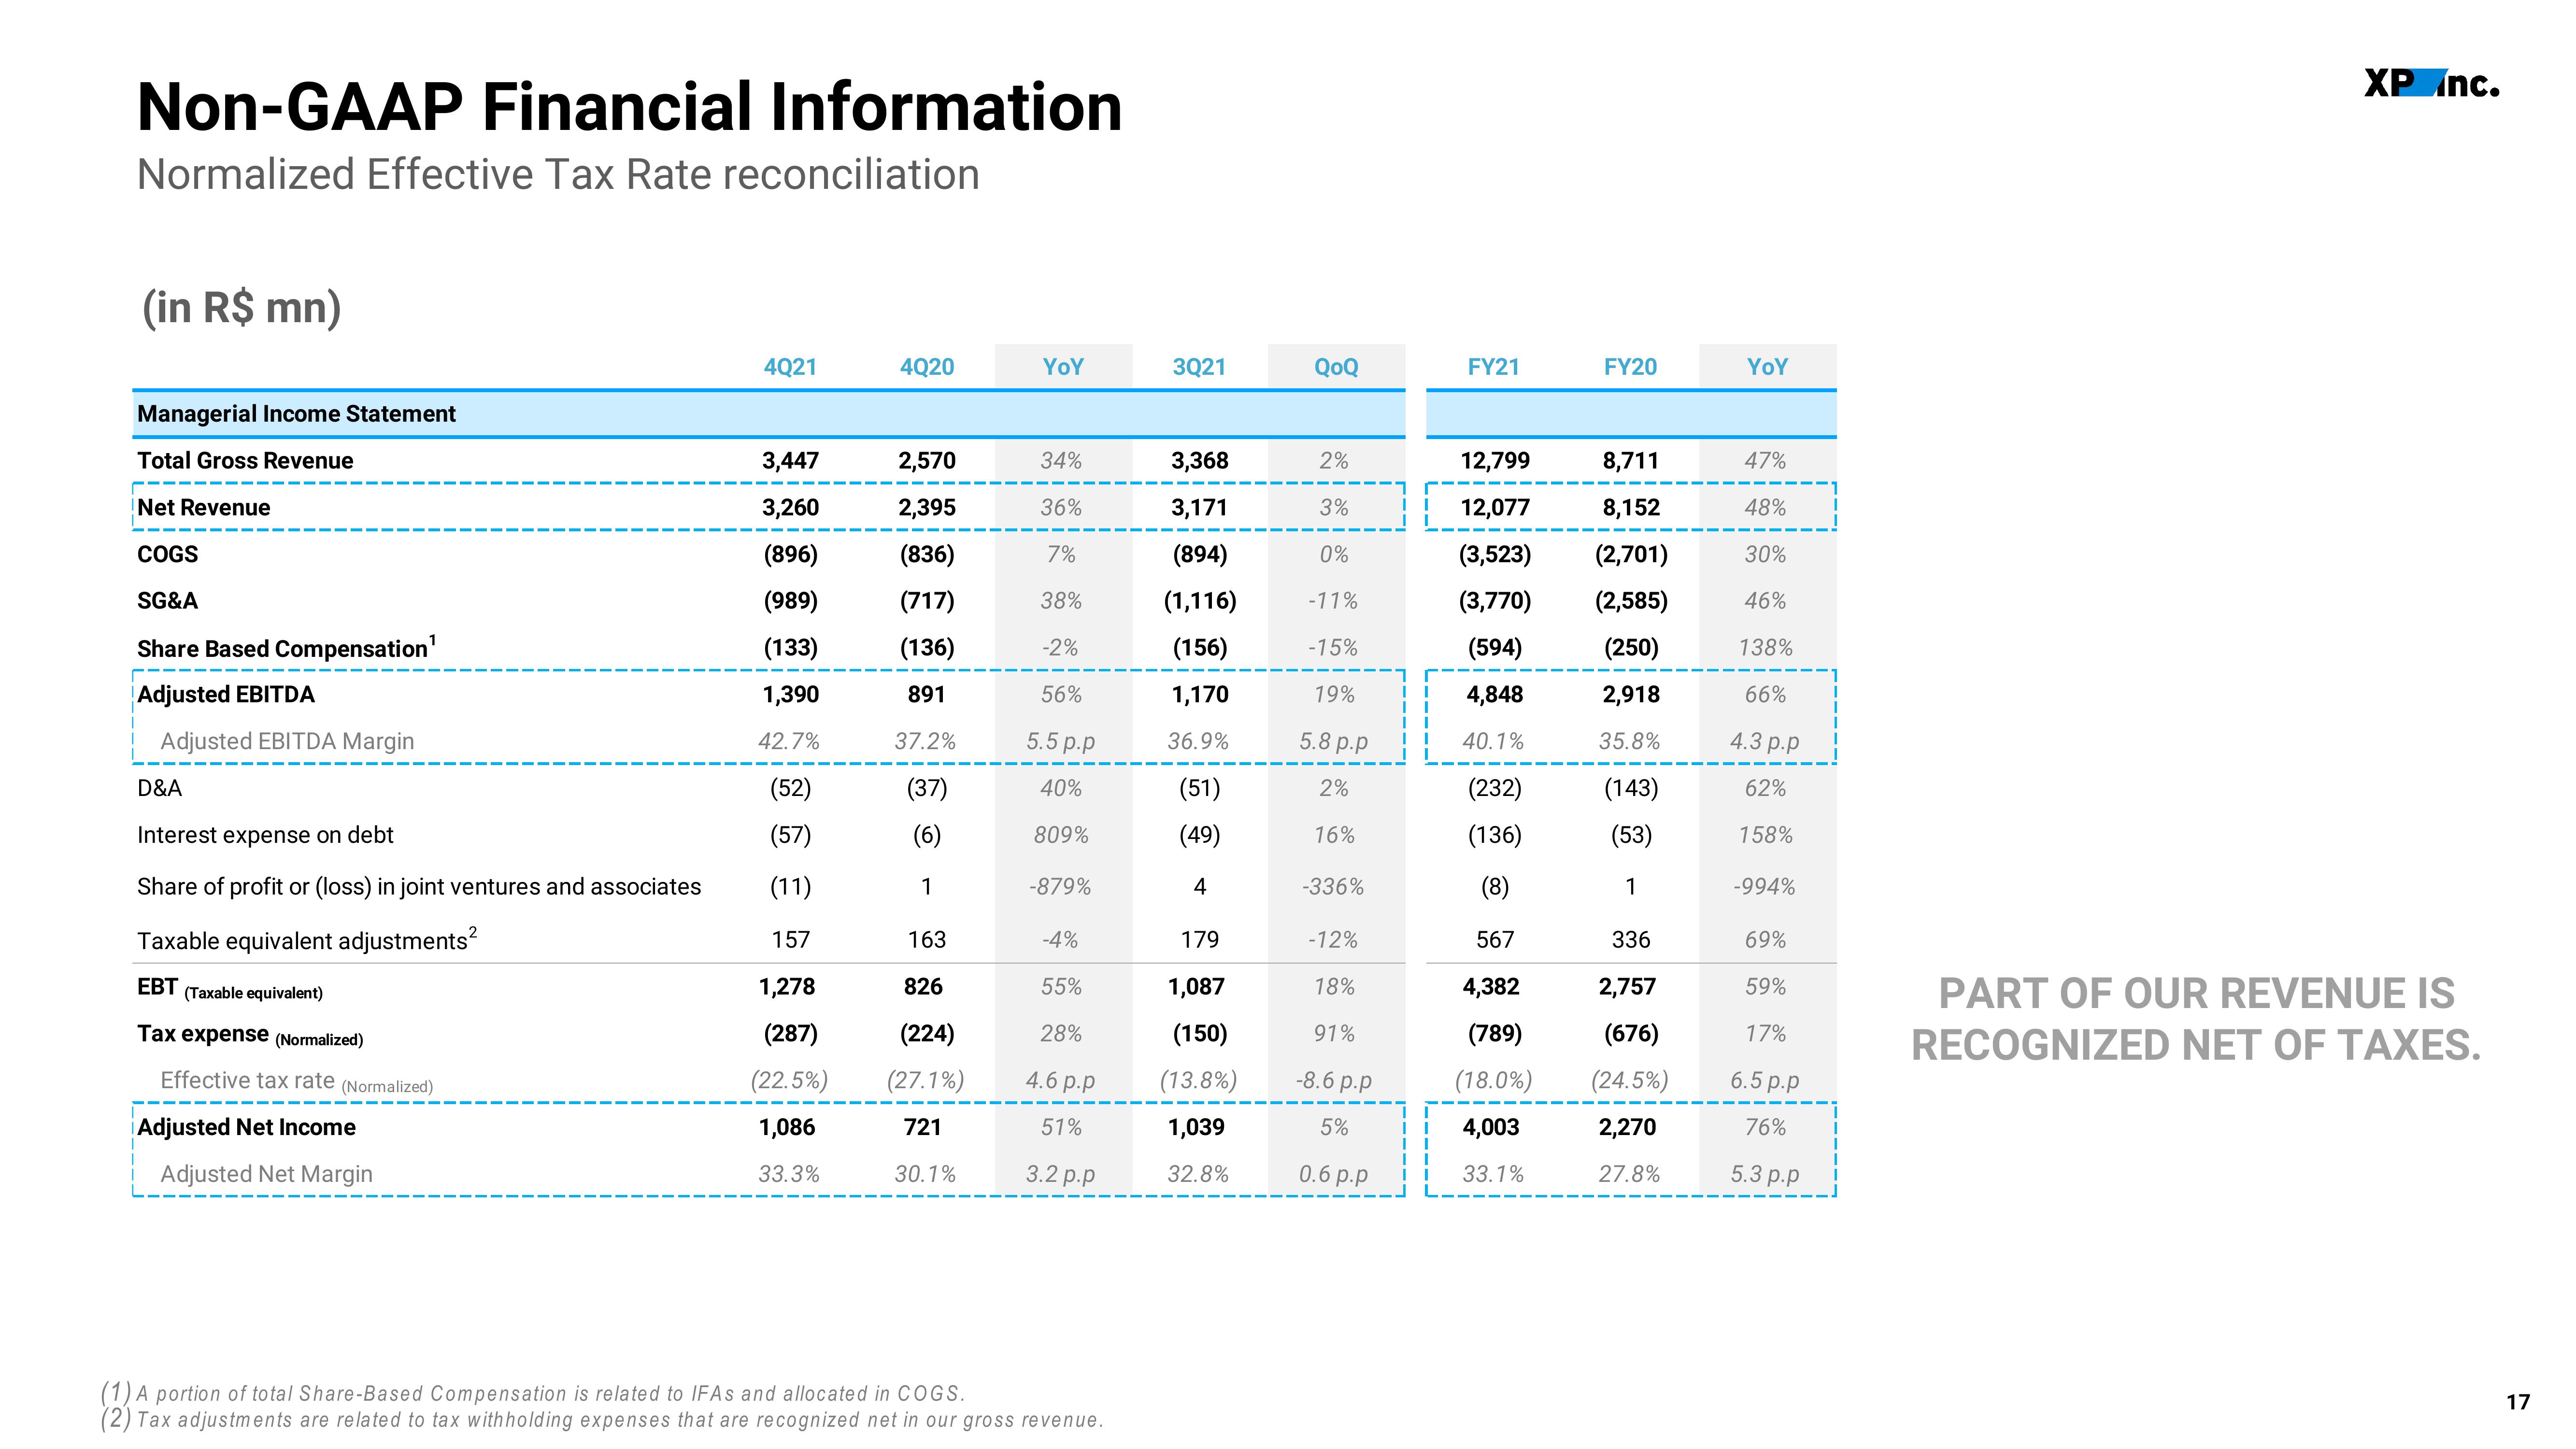
A portion of total Share-Based Compensation is related to IFAs and allocated in COGS.
(2) Tax adjustments are related to tax withholding expenses that are recognized net in our gross revenue.
3Q21
3,368
3,171
(894)
(1,116)
(156)
1,170
36.9%
(51)
(49)
4
179
1,087
(150)
(13.8%)
1,039
32.8%
QoQ
2%
3%
0%
-11%
-15%
19%
5.8 p.p
2%
16%
-336%
-12%
18%
91%
-8.6 p.p
5%
0.6 p.p
FY21
12,799
12,077
(3,523)
(3,770)
(594)
4,848
40.1%
(232)
(136)
(8)
567
4,382
(789)
(18.0%)
4,003
33.1%
FY20
8,711
8,152
(2,701)
(2,585)
(250)
2,918
35.8%
(143)
(53)
1
336
2,757
(676)
(24.5%)
2,270
27.8%
YoY
47%
48%
30%
46%
138%
66%
4.3 p.p
62%
158%
-994%
69%
59%
17%
6.5 p.p
76%
5.3 p.p
XP Inc.
PART OF OUR REVENUE IS
RECOGNIZED NET OF TAXES.
17View entire presentation