Verint SPAC Presentation Deck
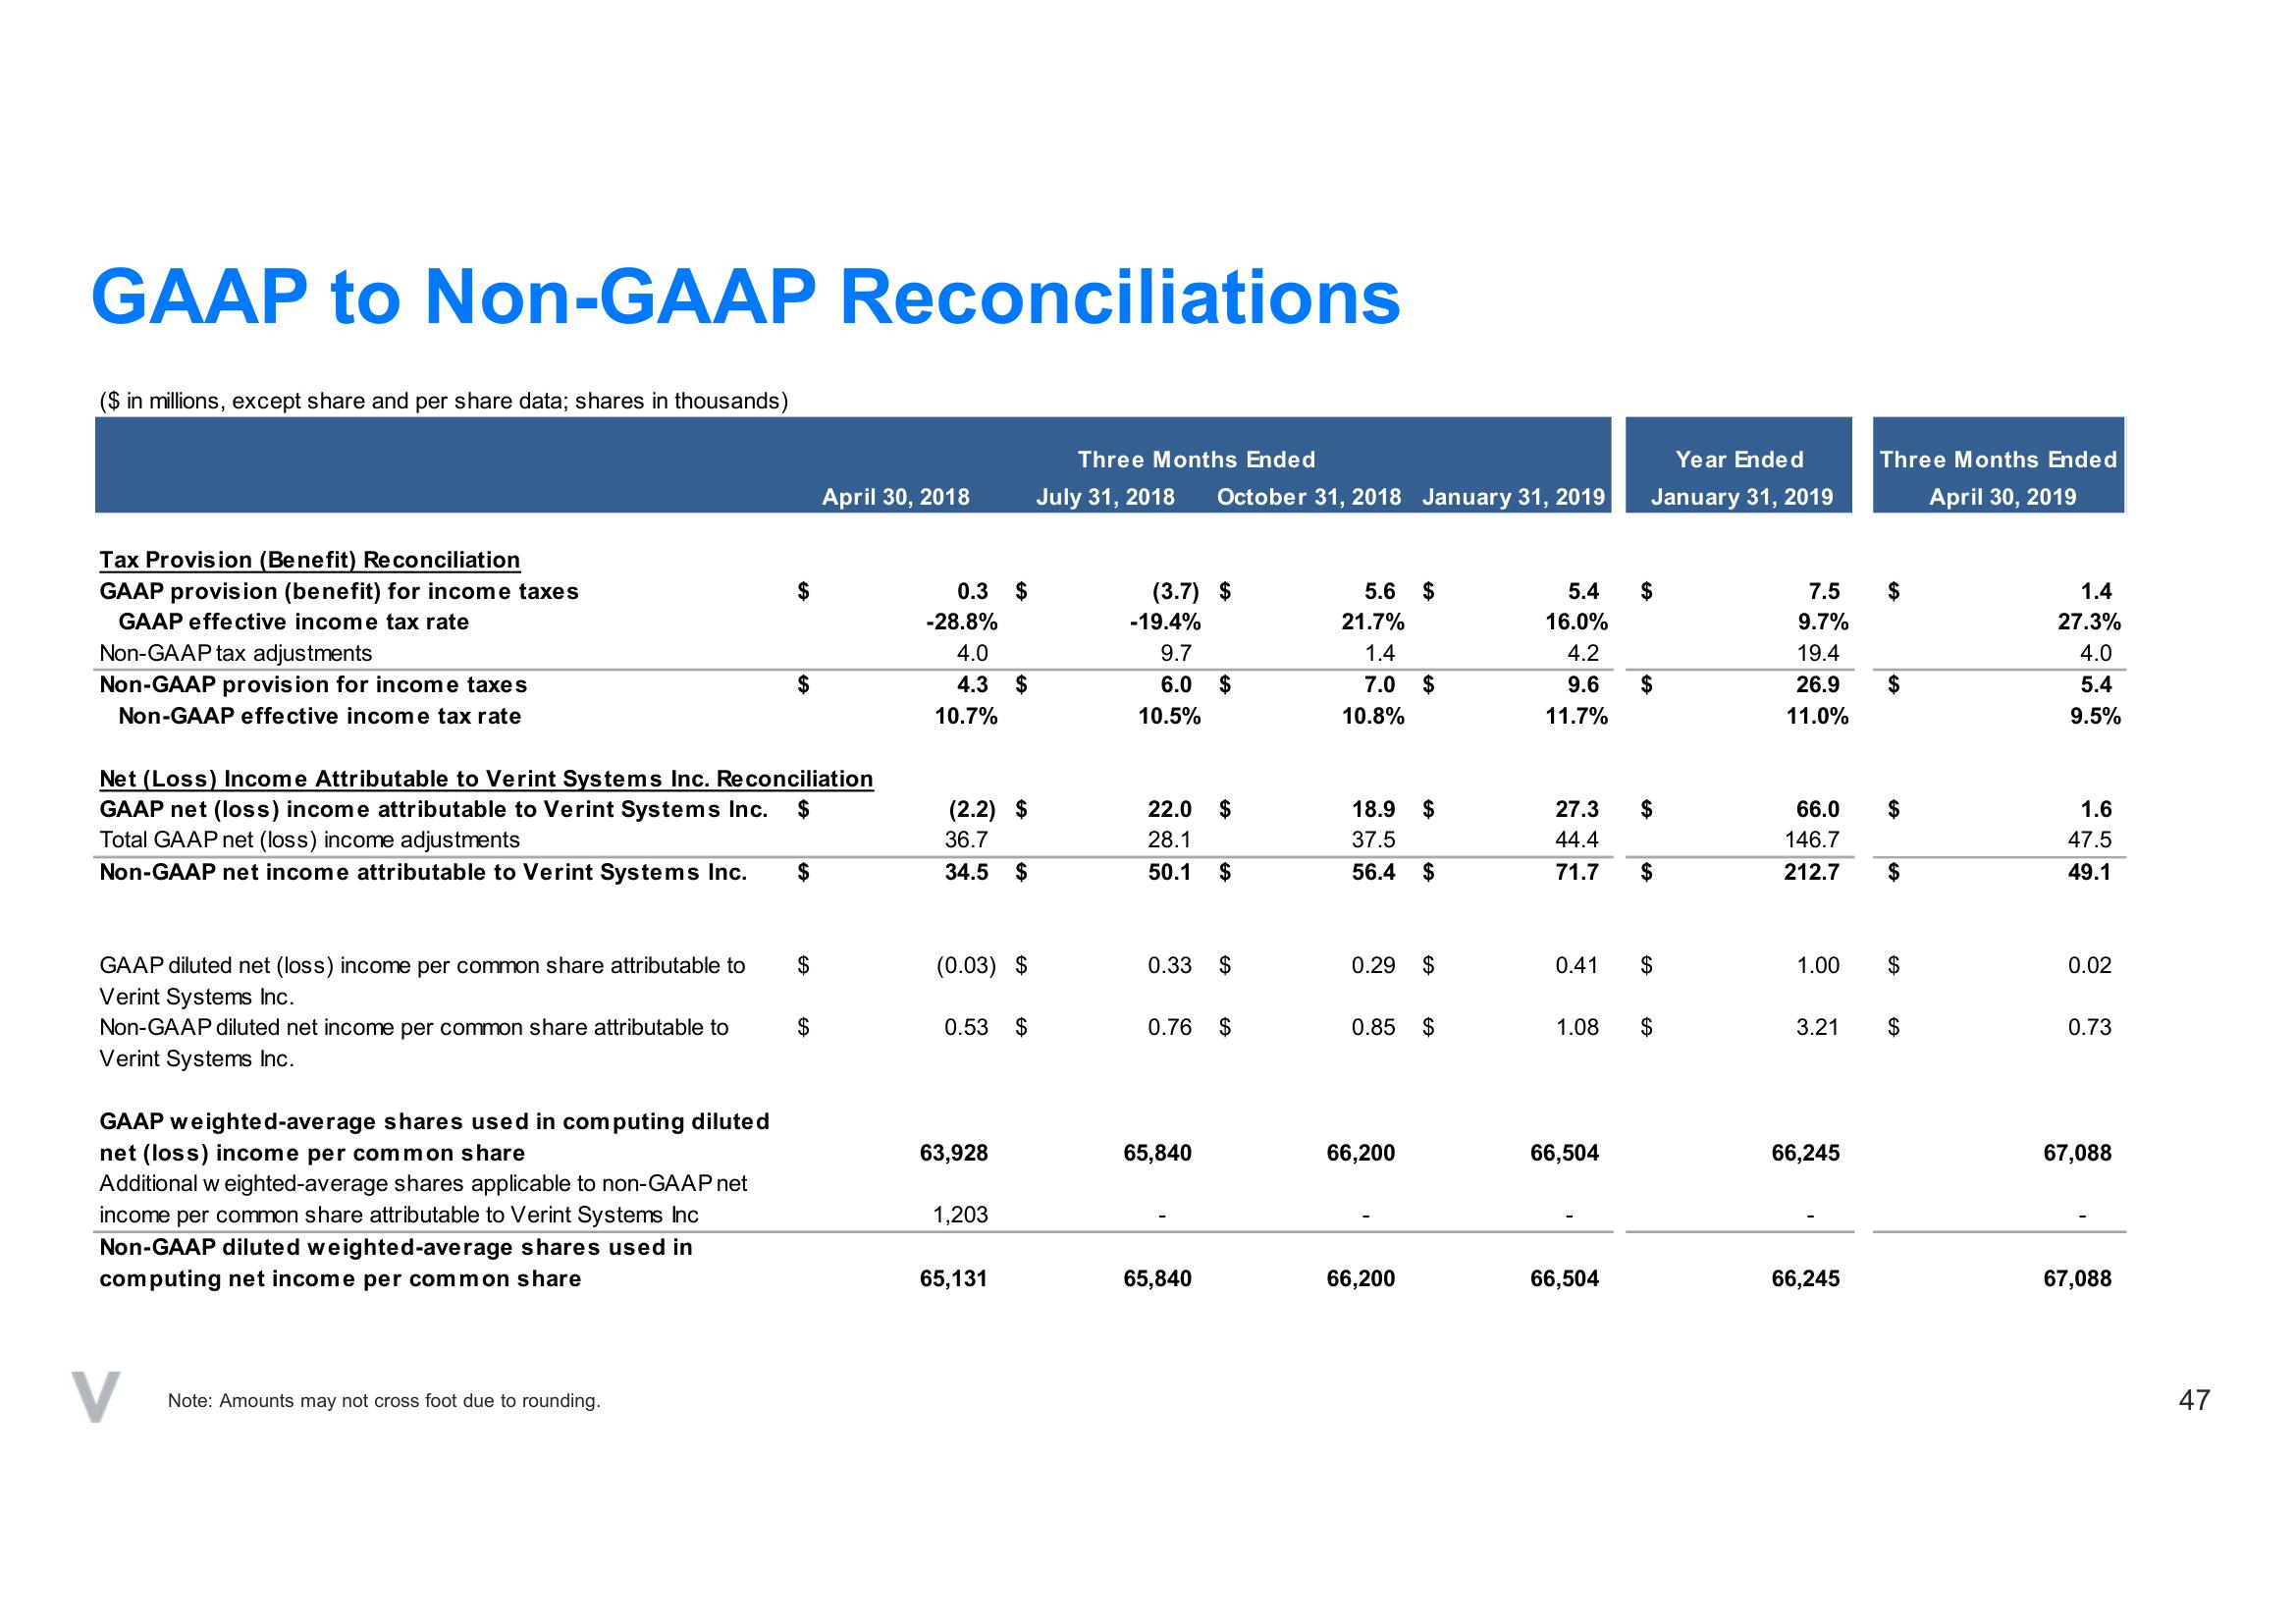
GAAP to Non-GAAP Reconciliations
($ in millions, except share and per share data; shares in thousands)
Tax Provision (Benefit) Reconciliation
GAAP provision (benefit) for income taxes
GAAP effective income tax rate
Non-GAAP tax adjustments
Non-GAAP provision for income taxes
Non-GAAP effective income tax rate
GAAP diluted net (loss) income per common share attributable to
Verint Systems Inc.
Non-GAAP diluted net income per common share attributable to
Verint Systems Inc.
GAAP weighted-average shares used in computing diluted
net (loss) income per common share
Net (Loss) Income Attributable to Verint Systems Inc. Reconciliation
GAAP net (loss) income attributable to Verint Systems Inc. $
Total GAAP net (loss) income adjustments
Non-GAAP net income attributable to Verint Systems Inc.
Additional weighted-average shares applicable to non-GAAP net
income per common share attributable to Verint Systems Inc
Non-GAAP diluted weighted-average shares used in
computing net income per common share
V
$
Note: Amounts may not cross foot due to rounding.
$
$
$
April 30, 2018
$
0.3 $
-28.8%
4.0
4.3 $
10.7%
(2.2) $
36.7
34.5 $
(0.03) $
0.53 $
63,928
1,203
65,131
Three Months Ended
July 31, 2018
(3.7) $
-19.4%
9.7
6.0 $
10.5%
22.0
28.1
50.1
October 31, 2018 January 31, 2019
65,840
$
0.33 $
65,840
$
0.76 $
$
5.6
21.7%
1.4
7.0 $
10.8%
18.9 $
37.5
56.4 $
0.29 $
0.85 $
66,200
66,200
5.4
16.0%
4.2
9.6
11.7%
27.3
44.4
71.7
0.41
1.08
66,504
66,504
Year Ended
January 31, 2019
$
$
$
$
$
$
7.5
9.7%
19.4
26.9
11.0%
66.0
146.7
212.7
1.00
3.21
66,245
66,245
Three Months Ended
April 30, 2019
$
$
$
$
GA
$
$
GA
1.4
27.3%
4.0
5.4
9.5%
1.6
47.5
49.1
0.02
0.73
67,088
67,088
47View entire presentation