Snap Inc Results Presentation Deck
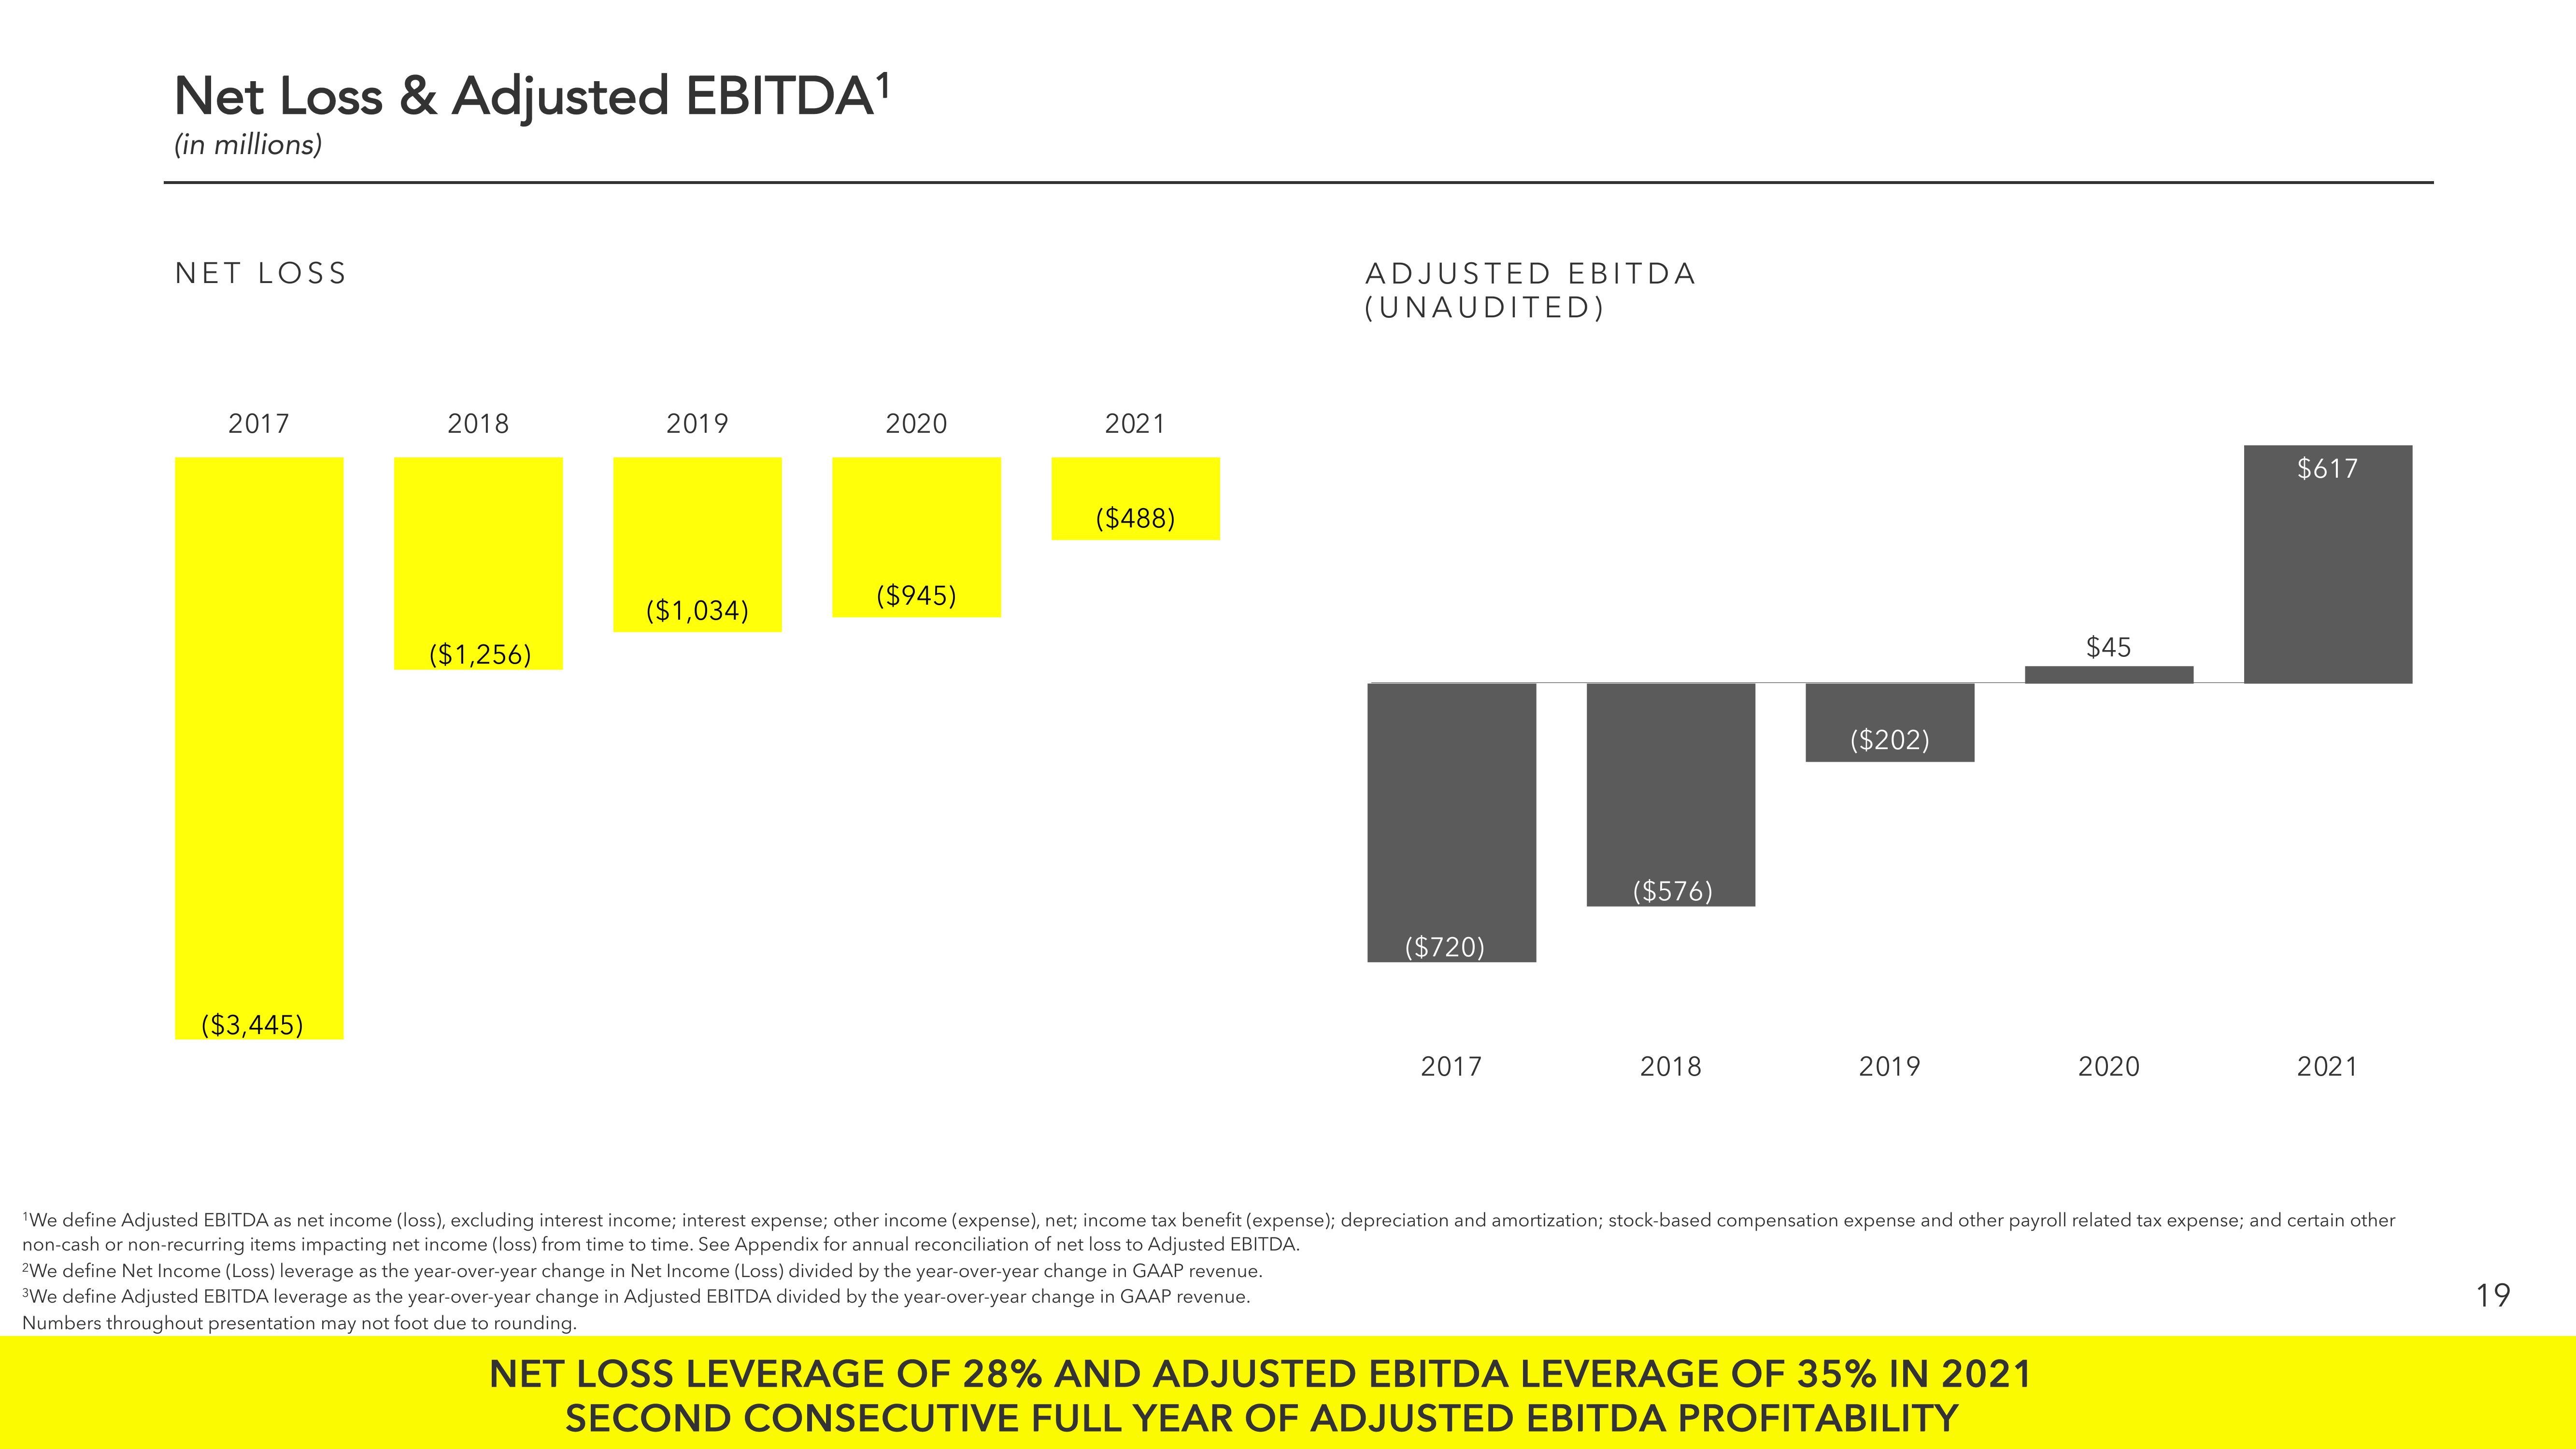
Net Loss & Adjusted EBITDA¹
(in millions)
NET LOSS
2017
($3,445)
2018
($1,256)
2019
($1,034)
2020
($945)
2021
($488)
ADJUSTED EBITDA
(UNAUDITED)
2We define Net Income (Loss) leverage as the year-over-year change in Net Income (Loss) divided by the year-over-year change in GAAP revenue.
³We define Adjusted EBITDA leverage as the year-over-year change in Adjusted EBITDA divided by the year-over-year change in GAAP revenue.
Numbers throughout presentation may not foot due to rounding.
($720)
2017
($576)
2018
($202)
2019
$45
NET LOSS LEVERAGE OF 28% AND ADJUSTED EBITDA LEVERAGE OF 35% IN 2021
SECOND CONSECUTIVE FULL YEAR OF ADJUSTED EBITDA PROFITABILITY
2020
$617
¹We define Adjusted EBITDA as net income (loss), excluding interest income; interest expense; other income (expense), net; income tax benefit (expense); depreciation and amortization; stock-based compensation expense and other payroll related tax expense; and certain other
non-cash or non-recurring items impacting net income (loss) from time to time. See Appendix for annual reconciliation of net loss to Adjusted EBITDA.
2021
19View entire presentation