Ambition 2024
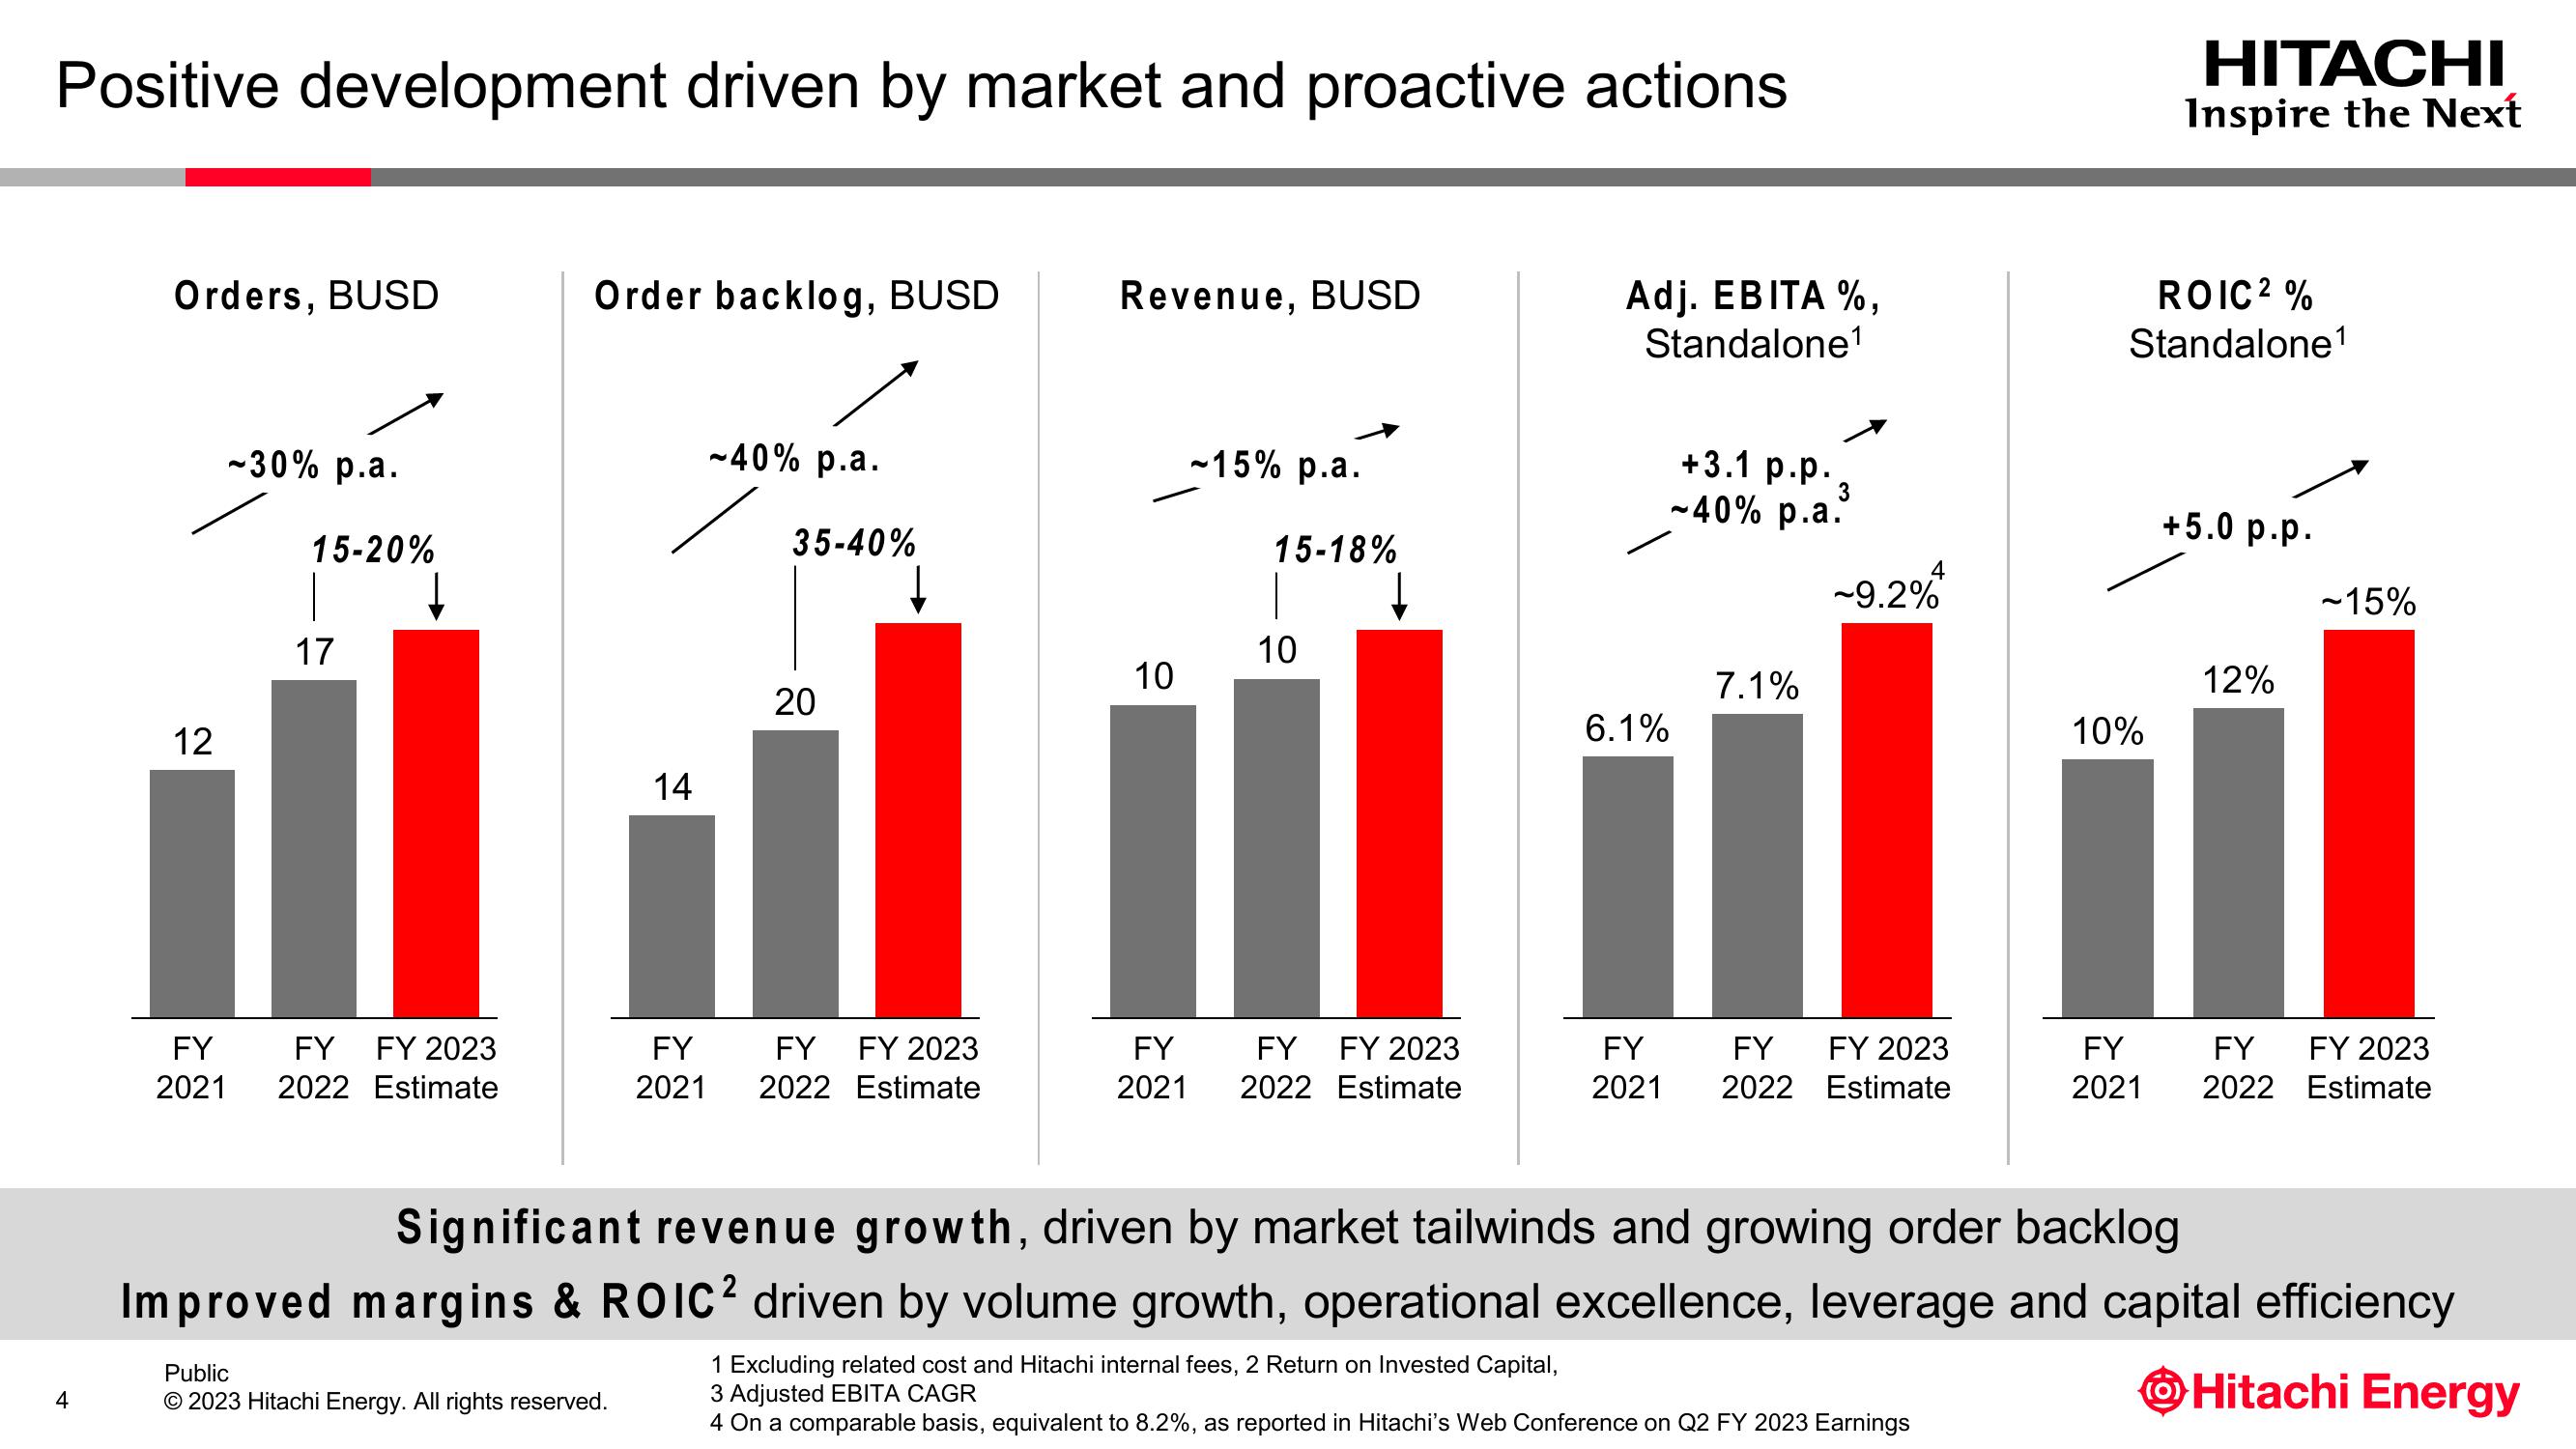
Positive development driven by market and proactive actions
Orders, BUSD
Order backlog, BUSD
Revenue, BUSD
Adj. EBITA %,
Standalone1
~30% p.a.
~40% p.a.
~15% p.a.
+3.1 p.p.
3
~40% p.a.
35-40%
15-18%
15-20%
4
~9.2%
10
12
17
10
7.1%
20
6.1%
14
HITACHI
Inspire the Next
ROIC2%
Standalone1
+5.0 p.p.
-15%
12%
10%
FY
2021
FY
FY 2023
2022 Estimate
FY
FY
FY 2023
FY
2021
2022 Estimate
2021
FY FY 2023
2022 Estimate
FY
FY
2021 2022
FY 2023
Estimate
FY
FY
2021
2022
FY 2023
Estimate
Significant revenue growth, driven by market tailwinds and growing order backlog
Improved margins & ROIC² driven by volume growth, operational excellence, leverage and capital efficiency
1 Excluding related cost and Hitachi internal fees, 2 Return on Invested Capital,
Public
© 2023 Hitachi Energy. All rights reserved.
3 Adjusted EBITA CAGR
4 On a comparable basis, equivalent to 8.2%, as reported in Hitachi's Web Conference on Q2 FY 2023 Earnings
Hitachi EnergyView entire presentation