Perfect SPAC Presentation Deck
PERFECT
155%
10
Perfect
95%
133% 132% 130% 130%
Doximity 3
Unity Software
Perfect
Datadog 4
87%
II
86%
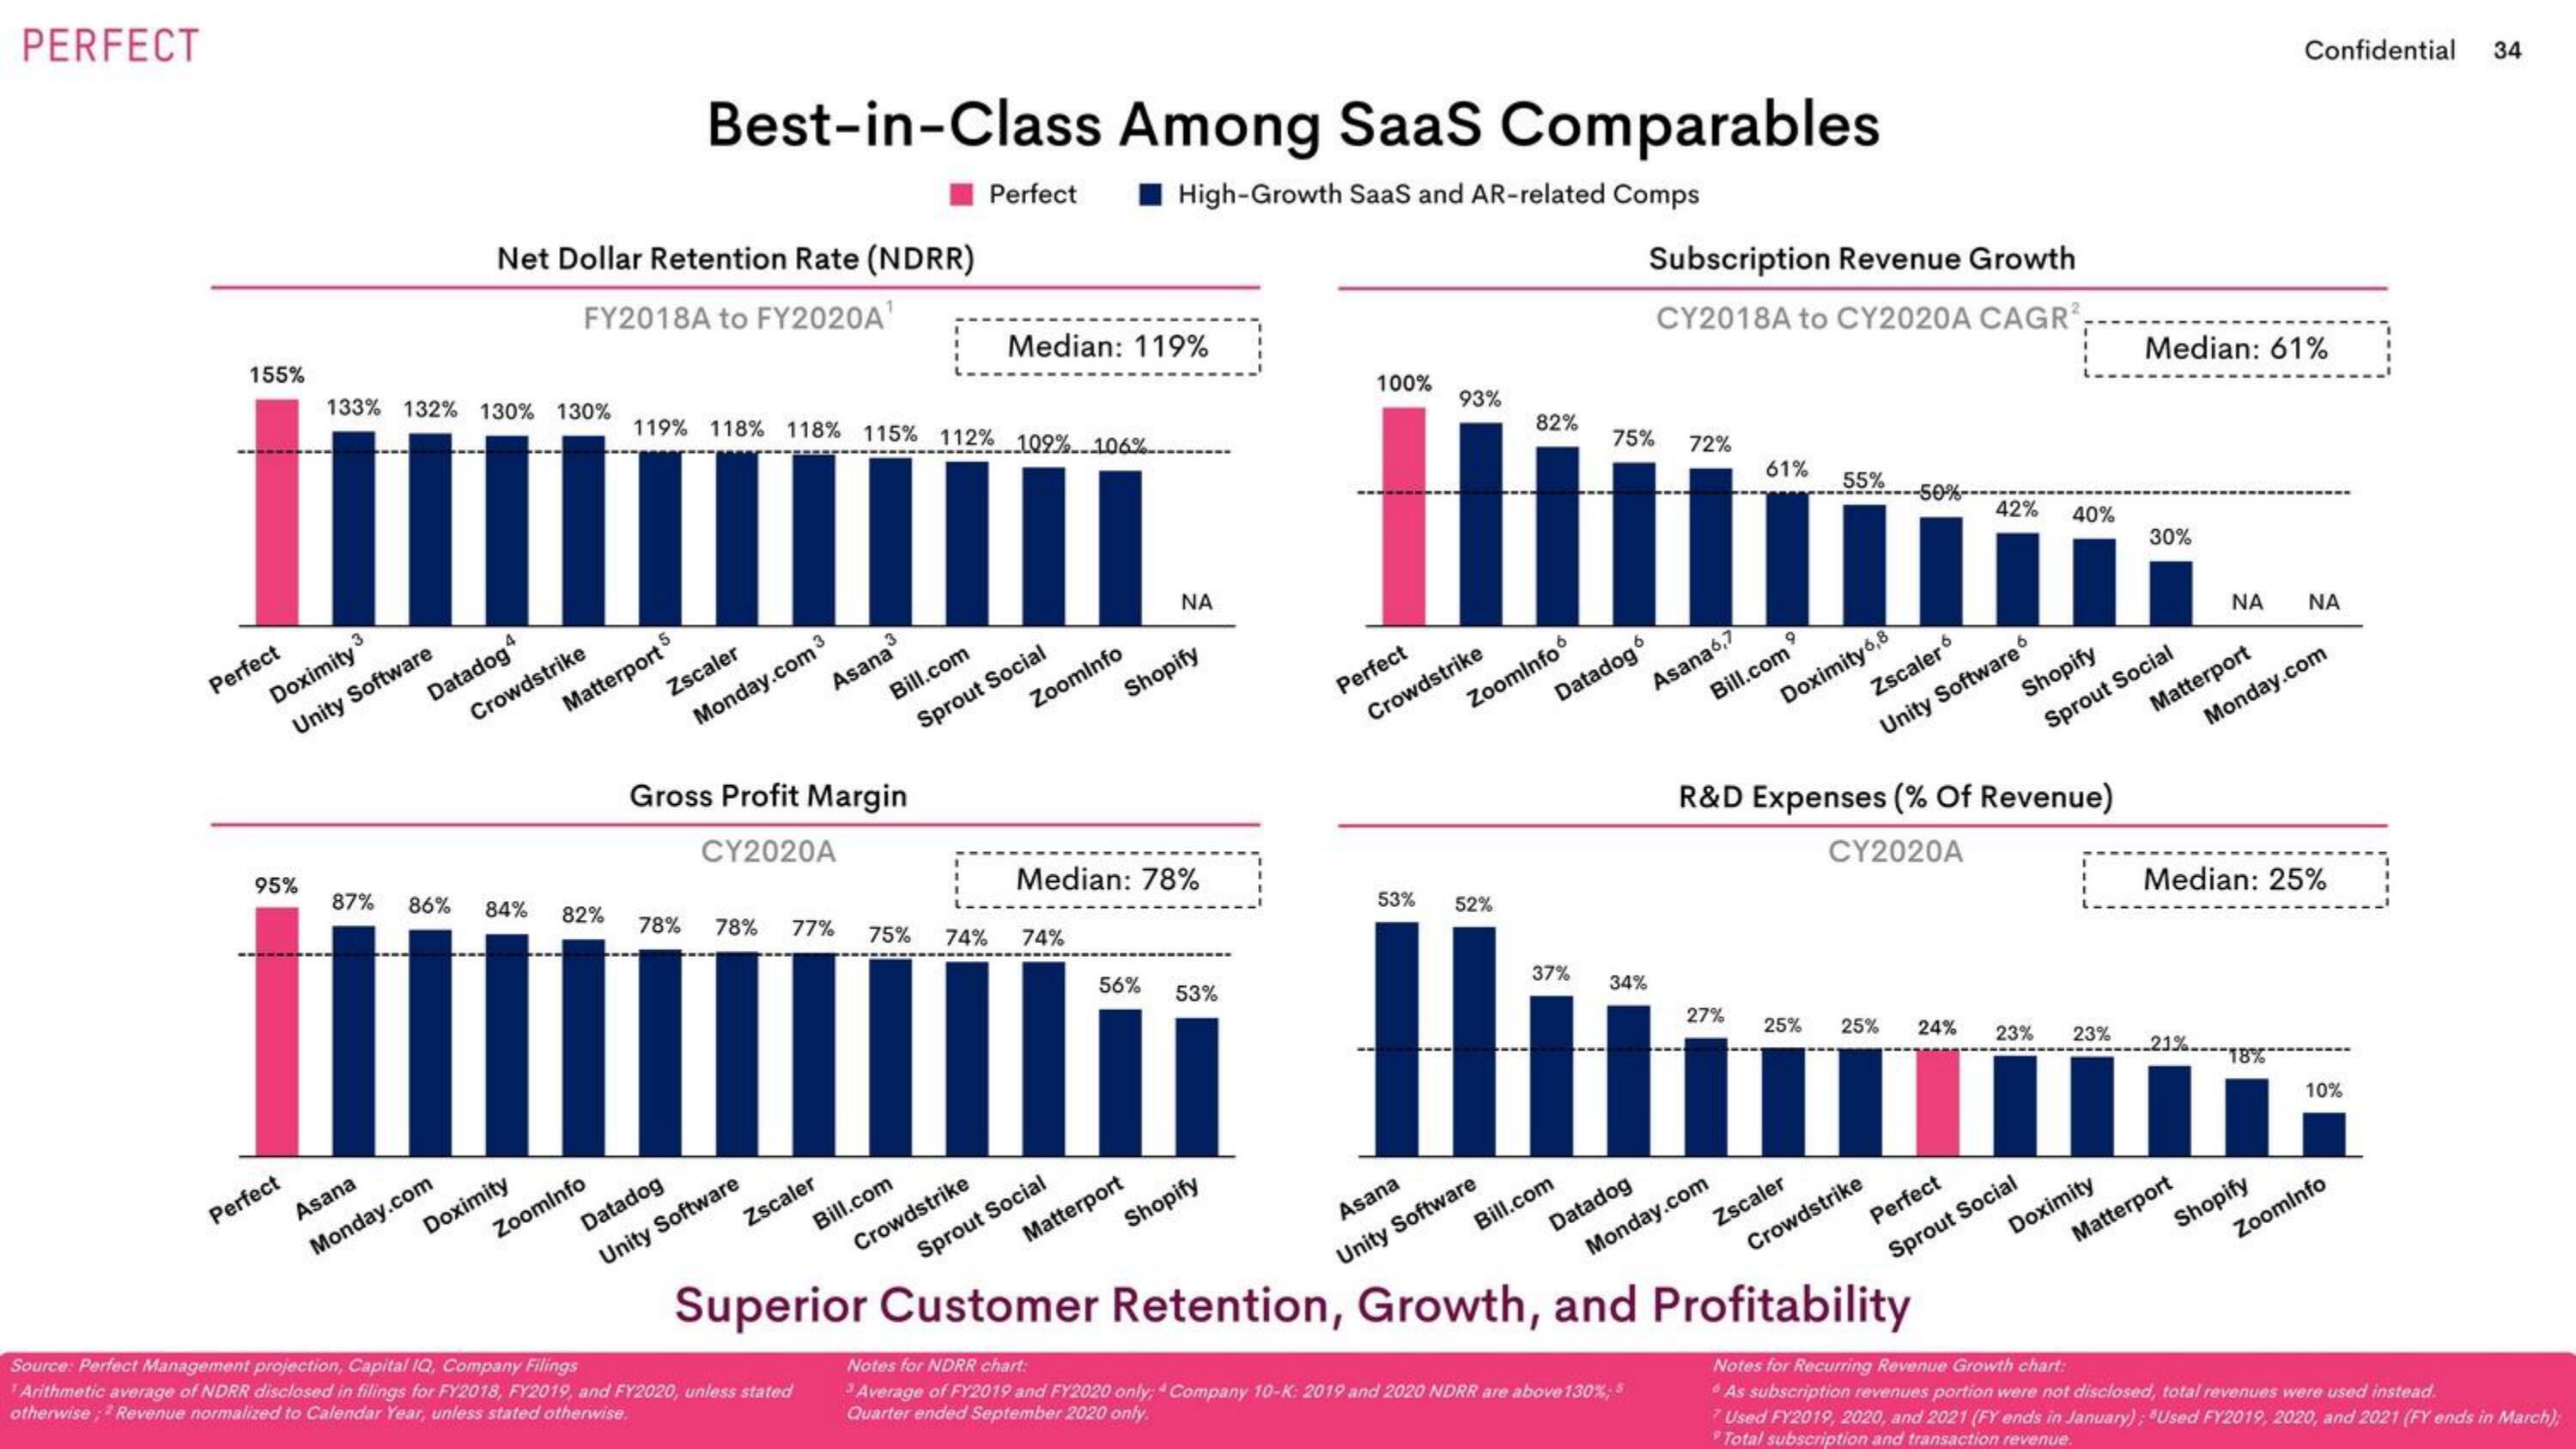
Net Dollar Retention Rate (NDRR)
FY2018A to FY2020A¹
Asana
Monday.com
Crowdstrike
84%
Doximity
Matterport 5
82%
Best-in-Class Among SaaS Comparables
High-Growth SaaS and AR-related Comps
Zoominfo
Zscaler
119% 118% 118% 115% 112% 109% 106%--
Monday.com 3
Datadog
Unity Software
Asana³
Gross Profit Margin
CY2020A
78% 78% 77%
Zscaler
Source: Perfect Management projection, Capital IQ, Company Filings
Arithmetic average of NDRR disclosed in filings for FY2018, FY2019, and FY2020, unless stated
otherwise2 Revenue normalized to Calendar Year, unless stated otherwise.
Bill.com
Sprout Social
75%
Perfect
Bill.com
Median: 119%
Crowdstrike
ZoomInfo
74% 74%
Shopify
Median: 78%
Sprout Social
ΝΑ
56%
Matterport
53%
Shopify
100%
93%
Perfect
Crowdstrike
53%
52%
82%
ZoomInfo
Asana
Unity Software
37%
Bill.com
Datadog6
Subscription Revenue Growth
CY2018A to CY2020A CAGR²,
75% 72%
Asana6,7
Datadog
34%
61%
Bill.com
27%
9
Monday.com
55%
Doximity 6,8
Zscaler
Zscaler6
Unity Software
R&D Expenses (% Of Revenue)
CY2020A
25% 25%
-50%-
Crowdstrike
Superior Customer Retention, Growth, and Profitability
Notes for NDRR chart:
Average of FY2019 and FY2020 only; Company 10-K: 2019 and 2020 NDRR are above 130%; $
Quarter ended September 2020 only.
42% 40%
24%
Perfect
Sprout Social
23% 23%
Shopify
Sprout Social
Doximity
Median: 61%
30%
Matterport
21%.
ΝΑ ΝΑ
Confidential 34
Median: 25%
Matterport
Monday.com
18%
Shopify
10%
Zoominfo
Notes for Recurring Revenue Growth chart:
As subscription revenues portion were not disclosed, total revenues were used instead.
7 Used FY2019, 2020, and 2021 (FY ends in January); "Used FY2019, 2020, and 2021 (FY ends in March);
Total subscription and transaction revenue.View entire presentation