Maersk Results Presentation Deck
A.P. Moller Maersk Group
- Interim Report 02 2015
MAERSK GROUP
PERFORMANCE
For Q2 2015
Contents
The Maersk Group delivered a satisfactory profit in Q2 of USD
1.1bn (USD 2.3bn) negatively impacted by the lower oil price
and lower average container freight rates. The return on in-
vested capital (ROIC) was 10.2% (18.6%). The result for Q2 last
year was positively impacted by a USD 2.8bn gain from the
sale of the majority share of Dansk Supermarked Group partly
offset by impairments of USD 1.7bn on Brazilian oil assets.
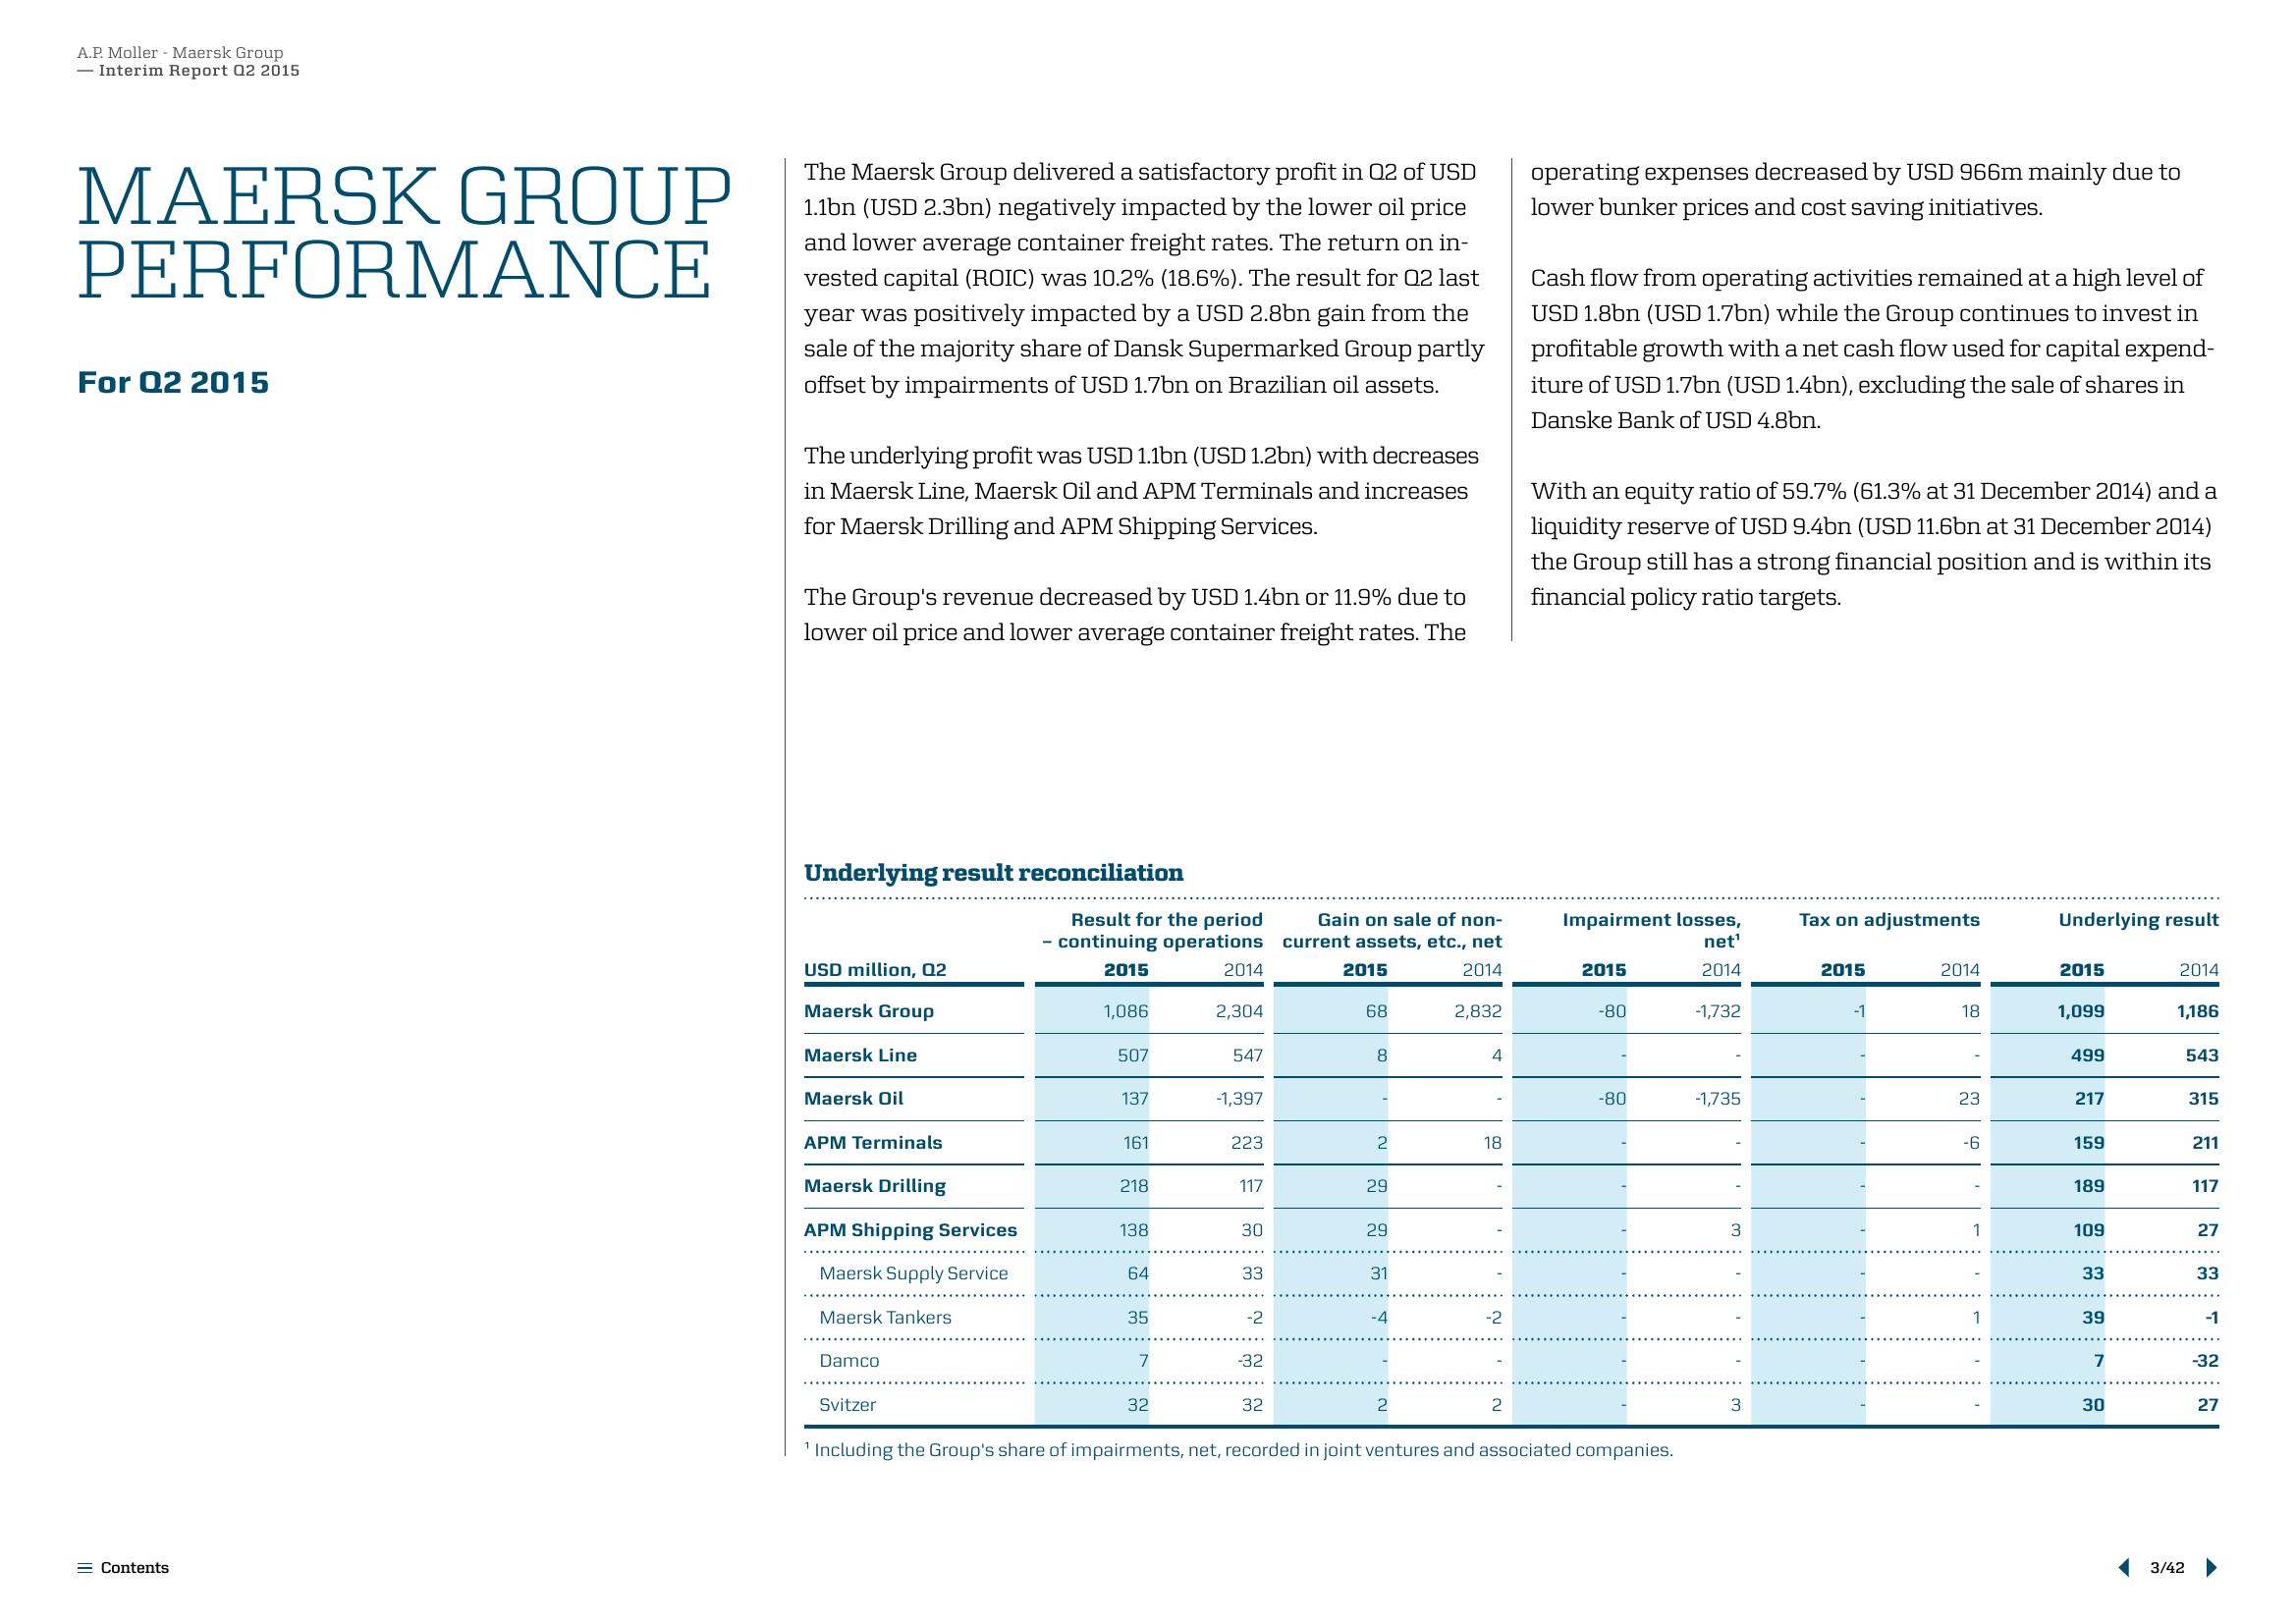
The underlying profit was USD 1.1bn (USD 1.2bn) with decreases
in Maersk Line, Maersk Oil and APM Terminals and increases
for Maersk Drilling and APM Shipping Services.
The Group's revenue decreased by USD 1.4bn or 11.9% due to
lower oil price and lower average container freight rates. The
Underlying result reconciliation
USD million, Q2
Maersk Group
Maersk Line
Maersk Oil
APM Terminals
Maersk Drilling
APM Shipping Services
Maersk Supply Service
Maersk Tankers
Damco
Svitzer
Result for the period
- continuing operations
2015
2014
1,086
507
137
161
218
138
64
35
7
32
2,304
547
-1,397
223
117
30
33
-2
-32
32
Gain on sale of non-
current assets, etc., net
2015
2014
68
8
-
2
29
29
31
-4
2
2,832
4
18
1
-2
2
operating expenses decreased by USD 966m mainly due to
lower bunker prices and cost saving initiatives.
Cash flow from operating activities remained at a high level of
USD 1.8bn (USD 1.7bn) while the Group continues to invest in
profitable growth with a net cash flow used for capital expend-
iture of USD 1.7bn (USD 1.4bn), excluding the sale of shares in
Danske Bank of USD 4.8bn.
With an equity ratio of 59.7% (61.3% at 31 December 2014) and a
liquidity reserve of USD 9.4bn (USD 11.6bn at 31 December 2014)
the Group still has a strong financial position and is within its
financial policy ratio targets.
Impairment losses,
net¹
2014
2015
-80
-80
'Including the Group's share of impairments, net, recorded in joint ventures and associated companies.
-1,732
-1,735
3
3
Tax on adjustments
2015
-1
2014
18
23
-6
1
1
Underlying result
2015
1,099
499
217
159
189
109
33
39
7
30
2014
1,186
3/42
543
315
211
117
27
33
-32
27View entire presentation