Verint SPAC Presentation Deck
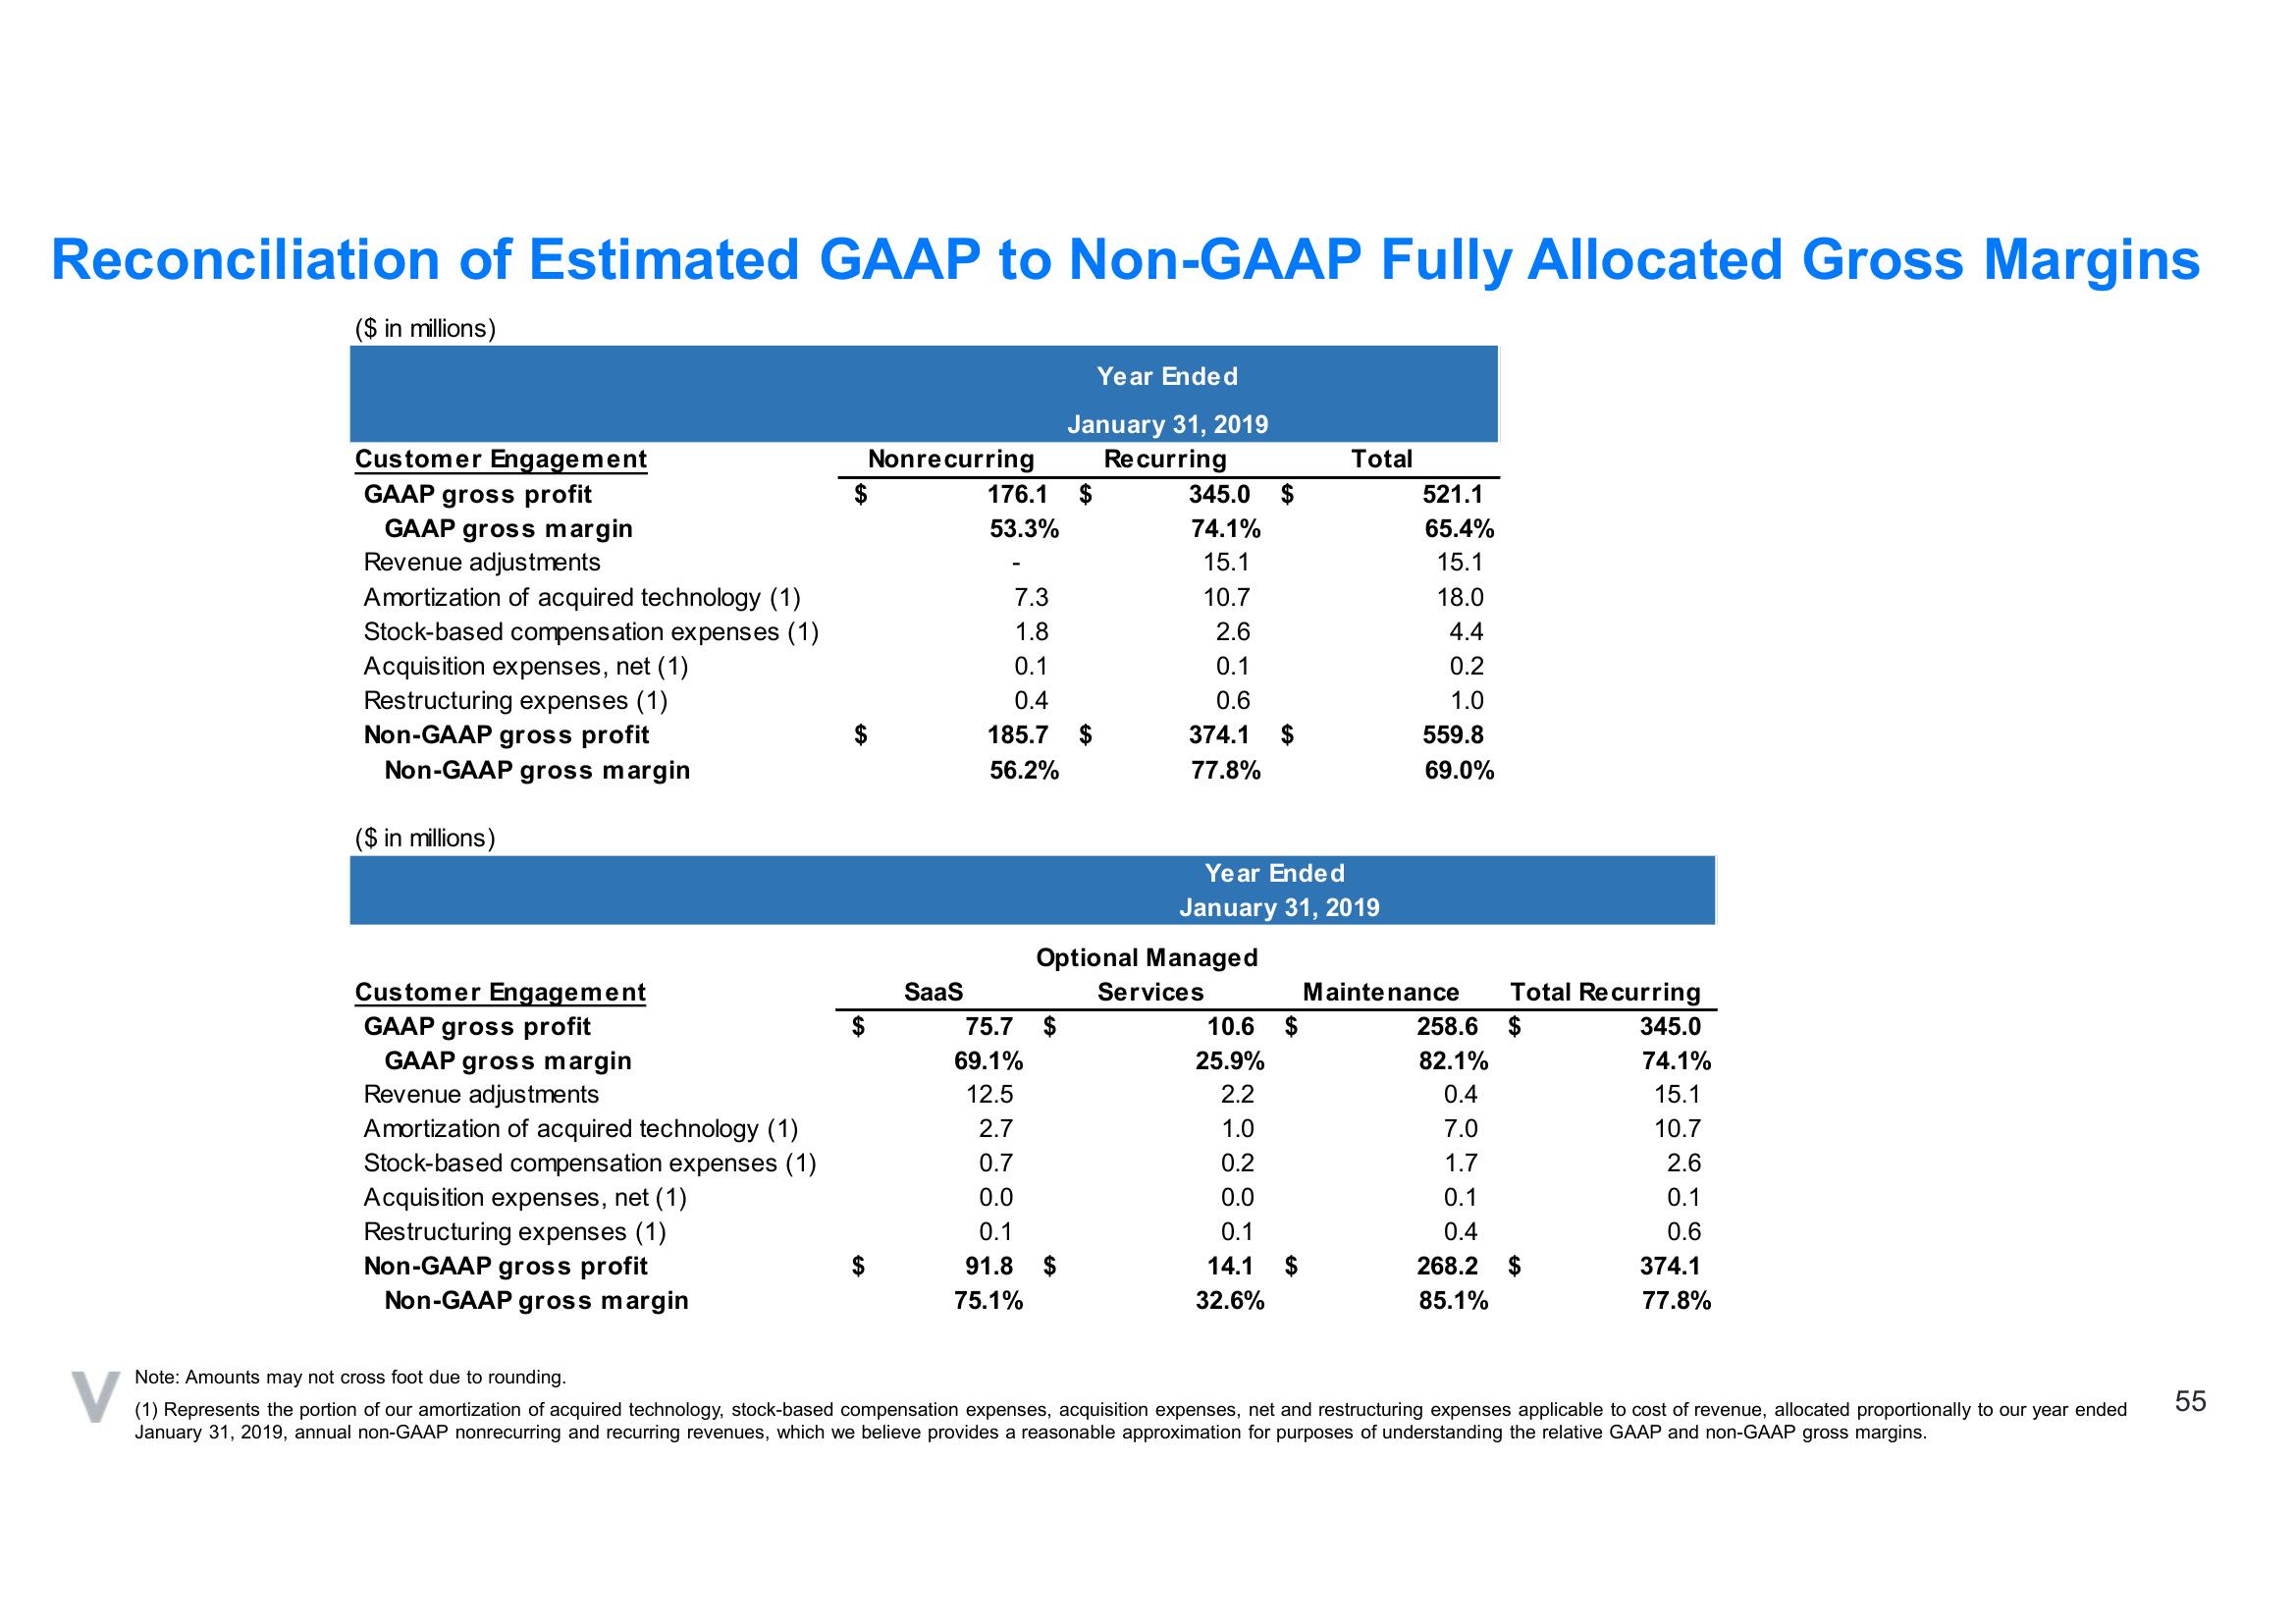
Reconciliation of Estimated GAAP to Non-GAAP Fully Allocated Gross Margins
($ in millions)
Customer Engagement
GAAP gross profit
GAAP gross margin
Revenue adjustments
Amortization of acquired technology (1)
Stock-based compensation expenses (1)
Acquisition expenses, net (1)
Restructuring expenses (1)
Non-GAAP gross profit
Non-GAAP gross margin
($ in millions)
Customer Engagement
GAAP gross profit
GAAP gross margin
Revenue adjustments
Amortization of acquired technology (1)
Stock-based compensation expenses (1)
Acquisition expenses, net (1)
Restructuring expenses (1)
Non-GAAP gross profit
Non-GAAP gross margin
$
Nonrecurring
SaaS
176.1
53.3%
7.3
1.8
0.1
0.4
185.7
56.2%
75.7 $
69.1%
12.5
2.7
0.7
0.0
0.1
91.8
75.1%
Year Ended
January 31, 2019
Recurring
$
$
345.0 $
74.1%
15.1
10.7
2.6
0.1
0.6
374.1
77.8%
Optional Managed
Services
$
Year Ended
January 31, 2019
10.6
25.9%
2.2
1.0
0.2
0.0
0.1
14.1
32.6%
$
Total
$
521.1
65.4%
15.1
18.0
4.4
0.2
1.0
559.8
69.0%
Maintenance
258.6
82.1%
0.4
7.0
1.7
0.1
0.4
268.2
85.1%
Total Recurring
$
$
345.0
74.1%
15.1
10.7
2.6
0.1
0.6
374.1
77.8%
Note: Amounts may not cross foot due to rounding.
(1) Represents the portion of our amortization of acquired technology, stock-based compensation expenses, acquisition expenses, net and restructuring expenses applicable to cost of revenue, allocated proportionally to our year ended
January 31, 2019, annual non-GAAP nonrecurring and recurring revenues, which we believe provides a reasonable approximation for purposes of understanding the relative GAAP and non-GAAP gross margins.
55View entire presentation