MP Materials Results Presentation Deck
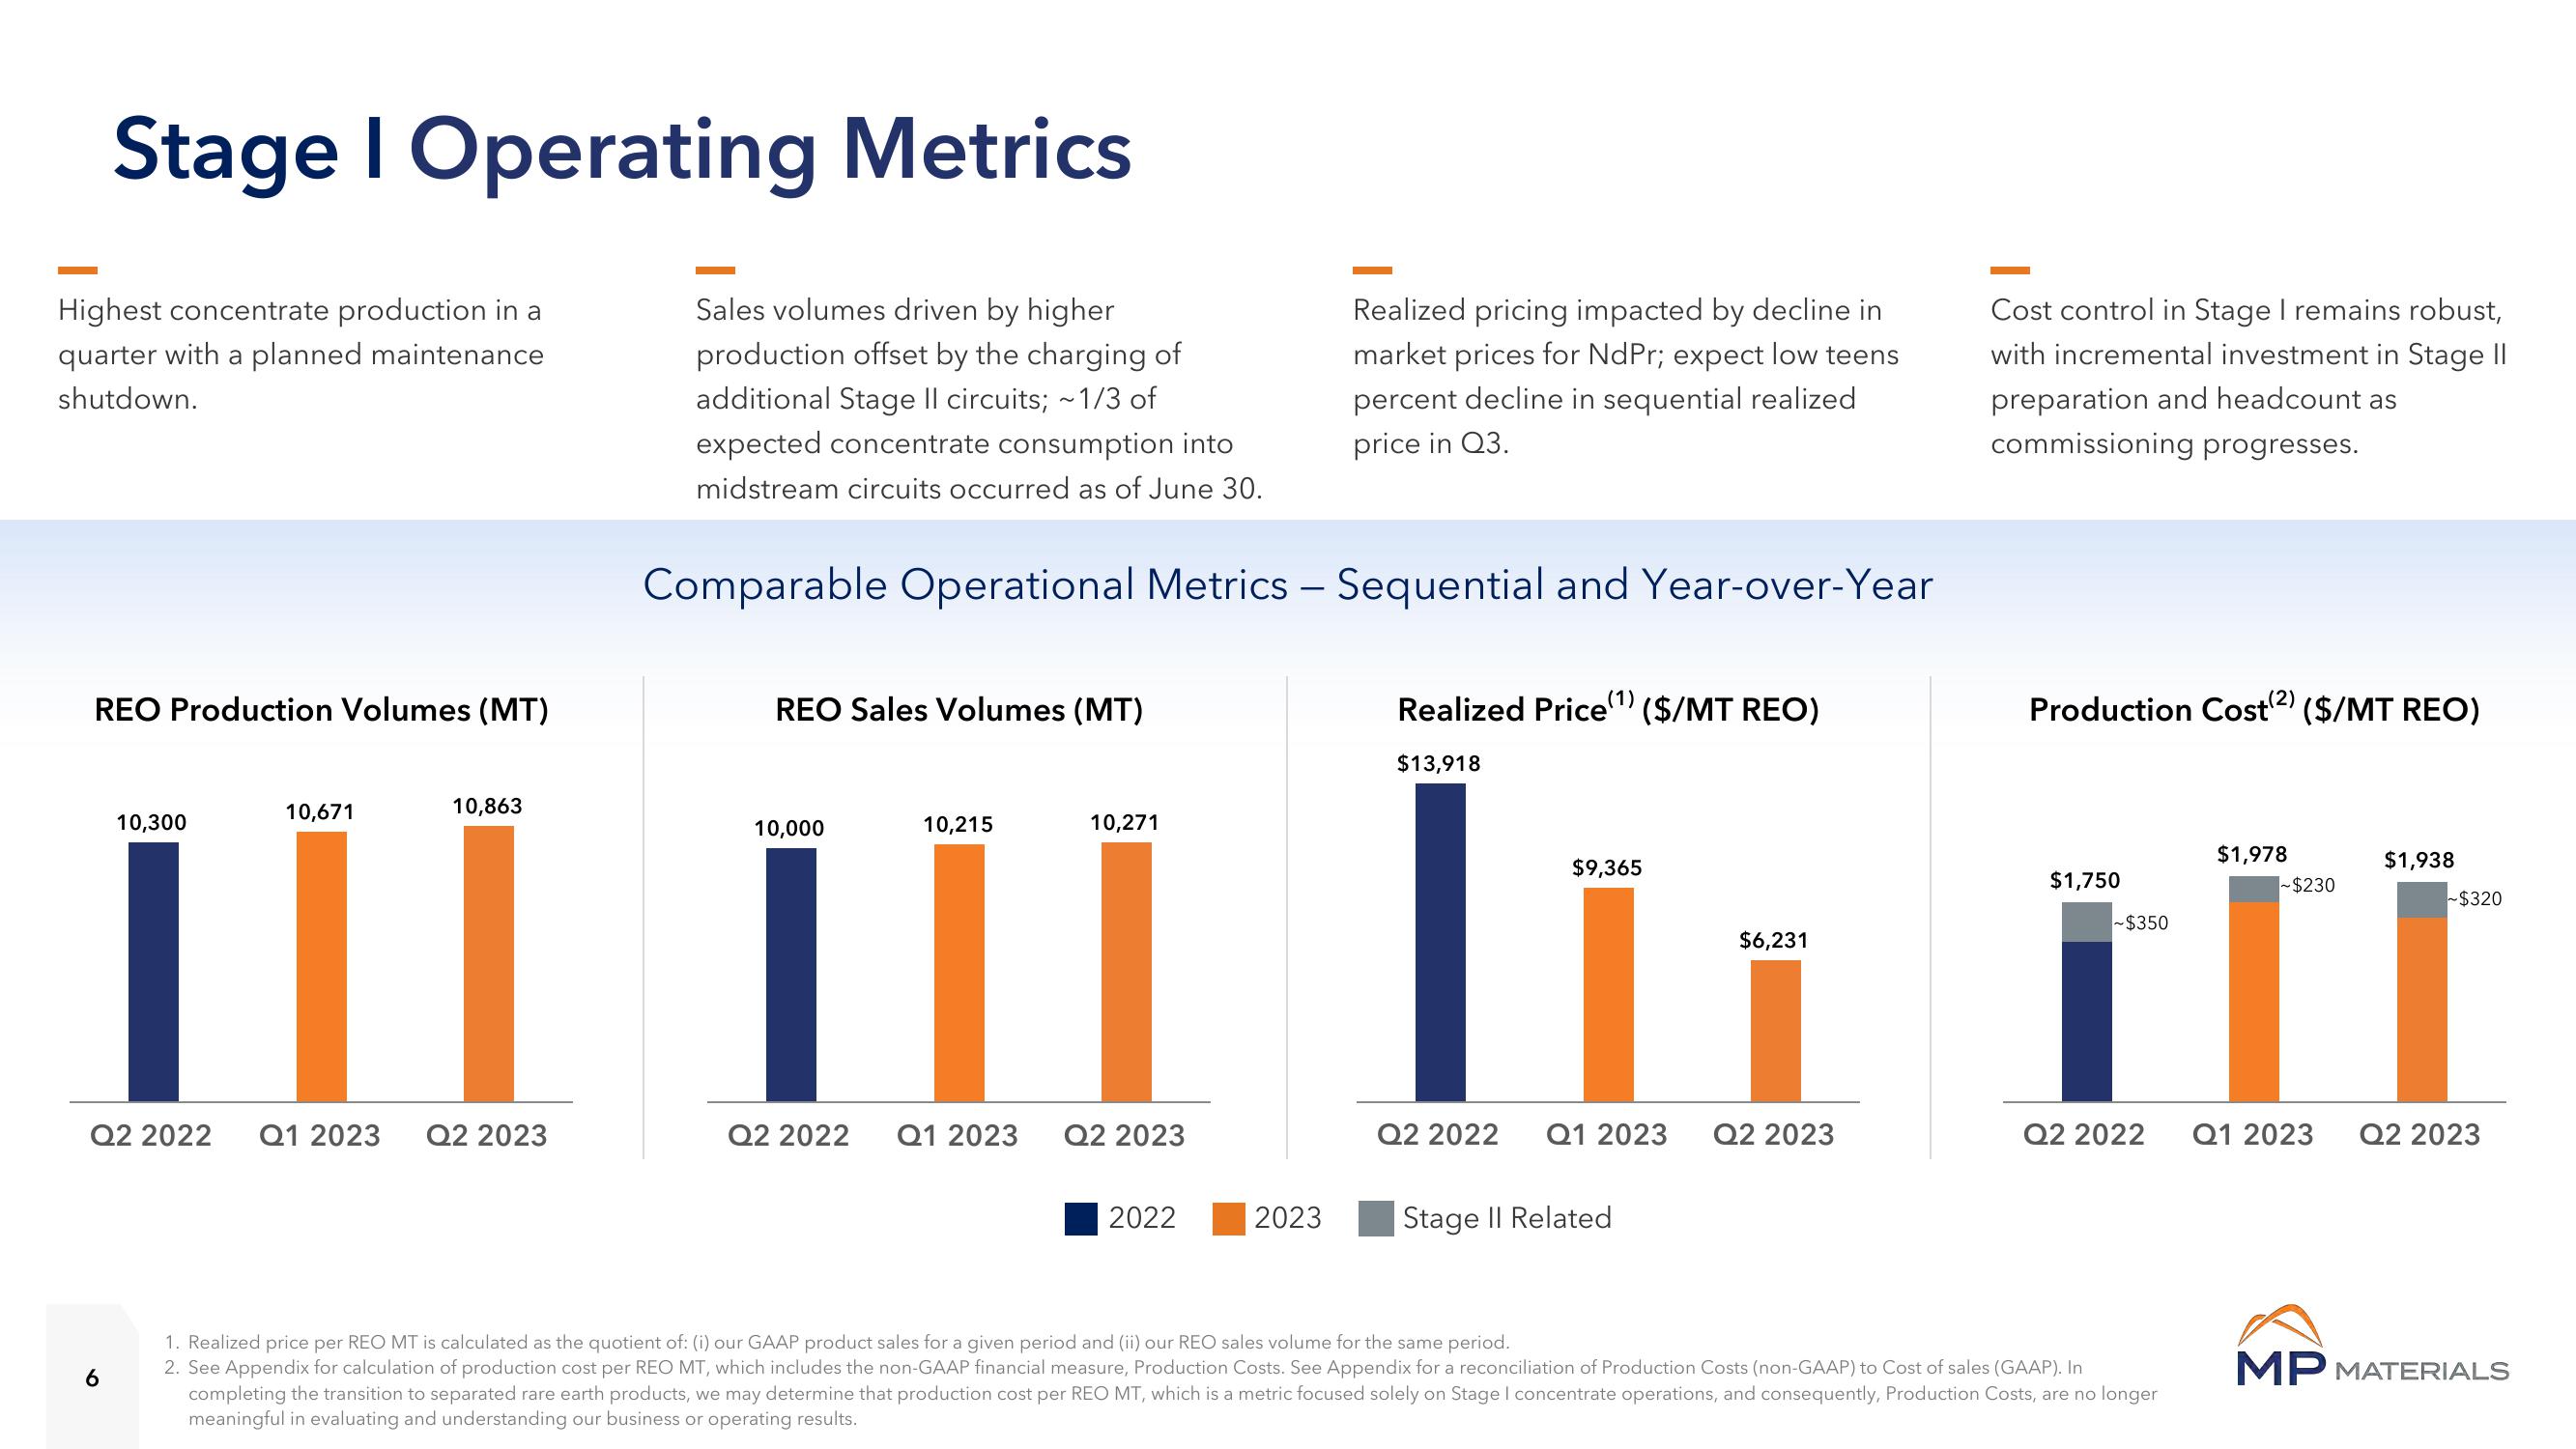
Stage I Operating Metrics
Highest concentrate production in a
quarter with a planned maintenance
shutdown.
REO Production Volumes (MT)
10,300
6
10,671
10,863
Q2 2022 Q1 2023 Q2 2023
Sales volumes driven by higher
production offset by the charging of
additional Stage Il circuits; ~1/3 of
expected concentrate consumption into
midstream circuits occurred as of June 30.
Comparable Operational Metrics – Sequential and Year-over-Year
REO Sales Volumes (MT)
10,000
10,215
11
Q2 2022 Q1 2023
10,271
Q2 2023
2022
2023
Realized pricing impacted by decline in
market prices for NdPr; expect low teens
percent decline in sequential realized
price in Q3.
Realized Price(¹) ($/MT REO)
$13,918
$9,365
Q2 2022 Q1 2023
Stage II Related
$6,231
Q2 2023
Cost control in Stage I remains robust,
with incremental investment in Stage II
preparation and headcount as
commissioning progresses.
Production Cost(²) ($/MT REO)
$1,750
~$350
Q2 2022
1. Realized price per REO MT is calculated as the quotient of: (i) our GAAP product sales for a given period and (ii) our REO sales volume for the same period.
2. See Appendix for calculation of production cost per REO MT, which includes the non-GAAP financial measure, Production Costs. See Appendix for a reconciliation of Production Costs (non-GAAP) to Cost of sales (GAAP). In
completing the transition to separated rare earth products, we may determine that production cost per REO MT, which is a metric focused solely on Stage I concentrate operations, and consequently, Production Costs, are no longer
meaningful in evaluating and understanding our business or operating results.
$1,978
-$230
$1,938
~$320
Q1 2023 Q2 2023
MP MATERIALSView entire presentation