Enovix SPAC Presentation Deck
36
Financials
Operating expenses:
Cost of revenue
Research and development
Selling, general and administrative
Total operating expenses
Loss from operations
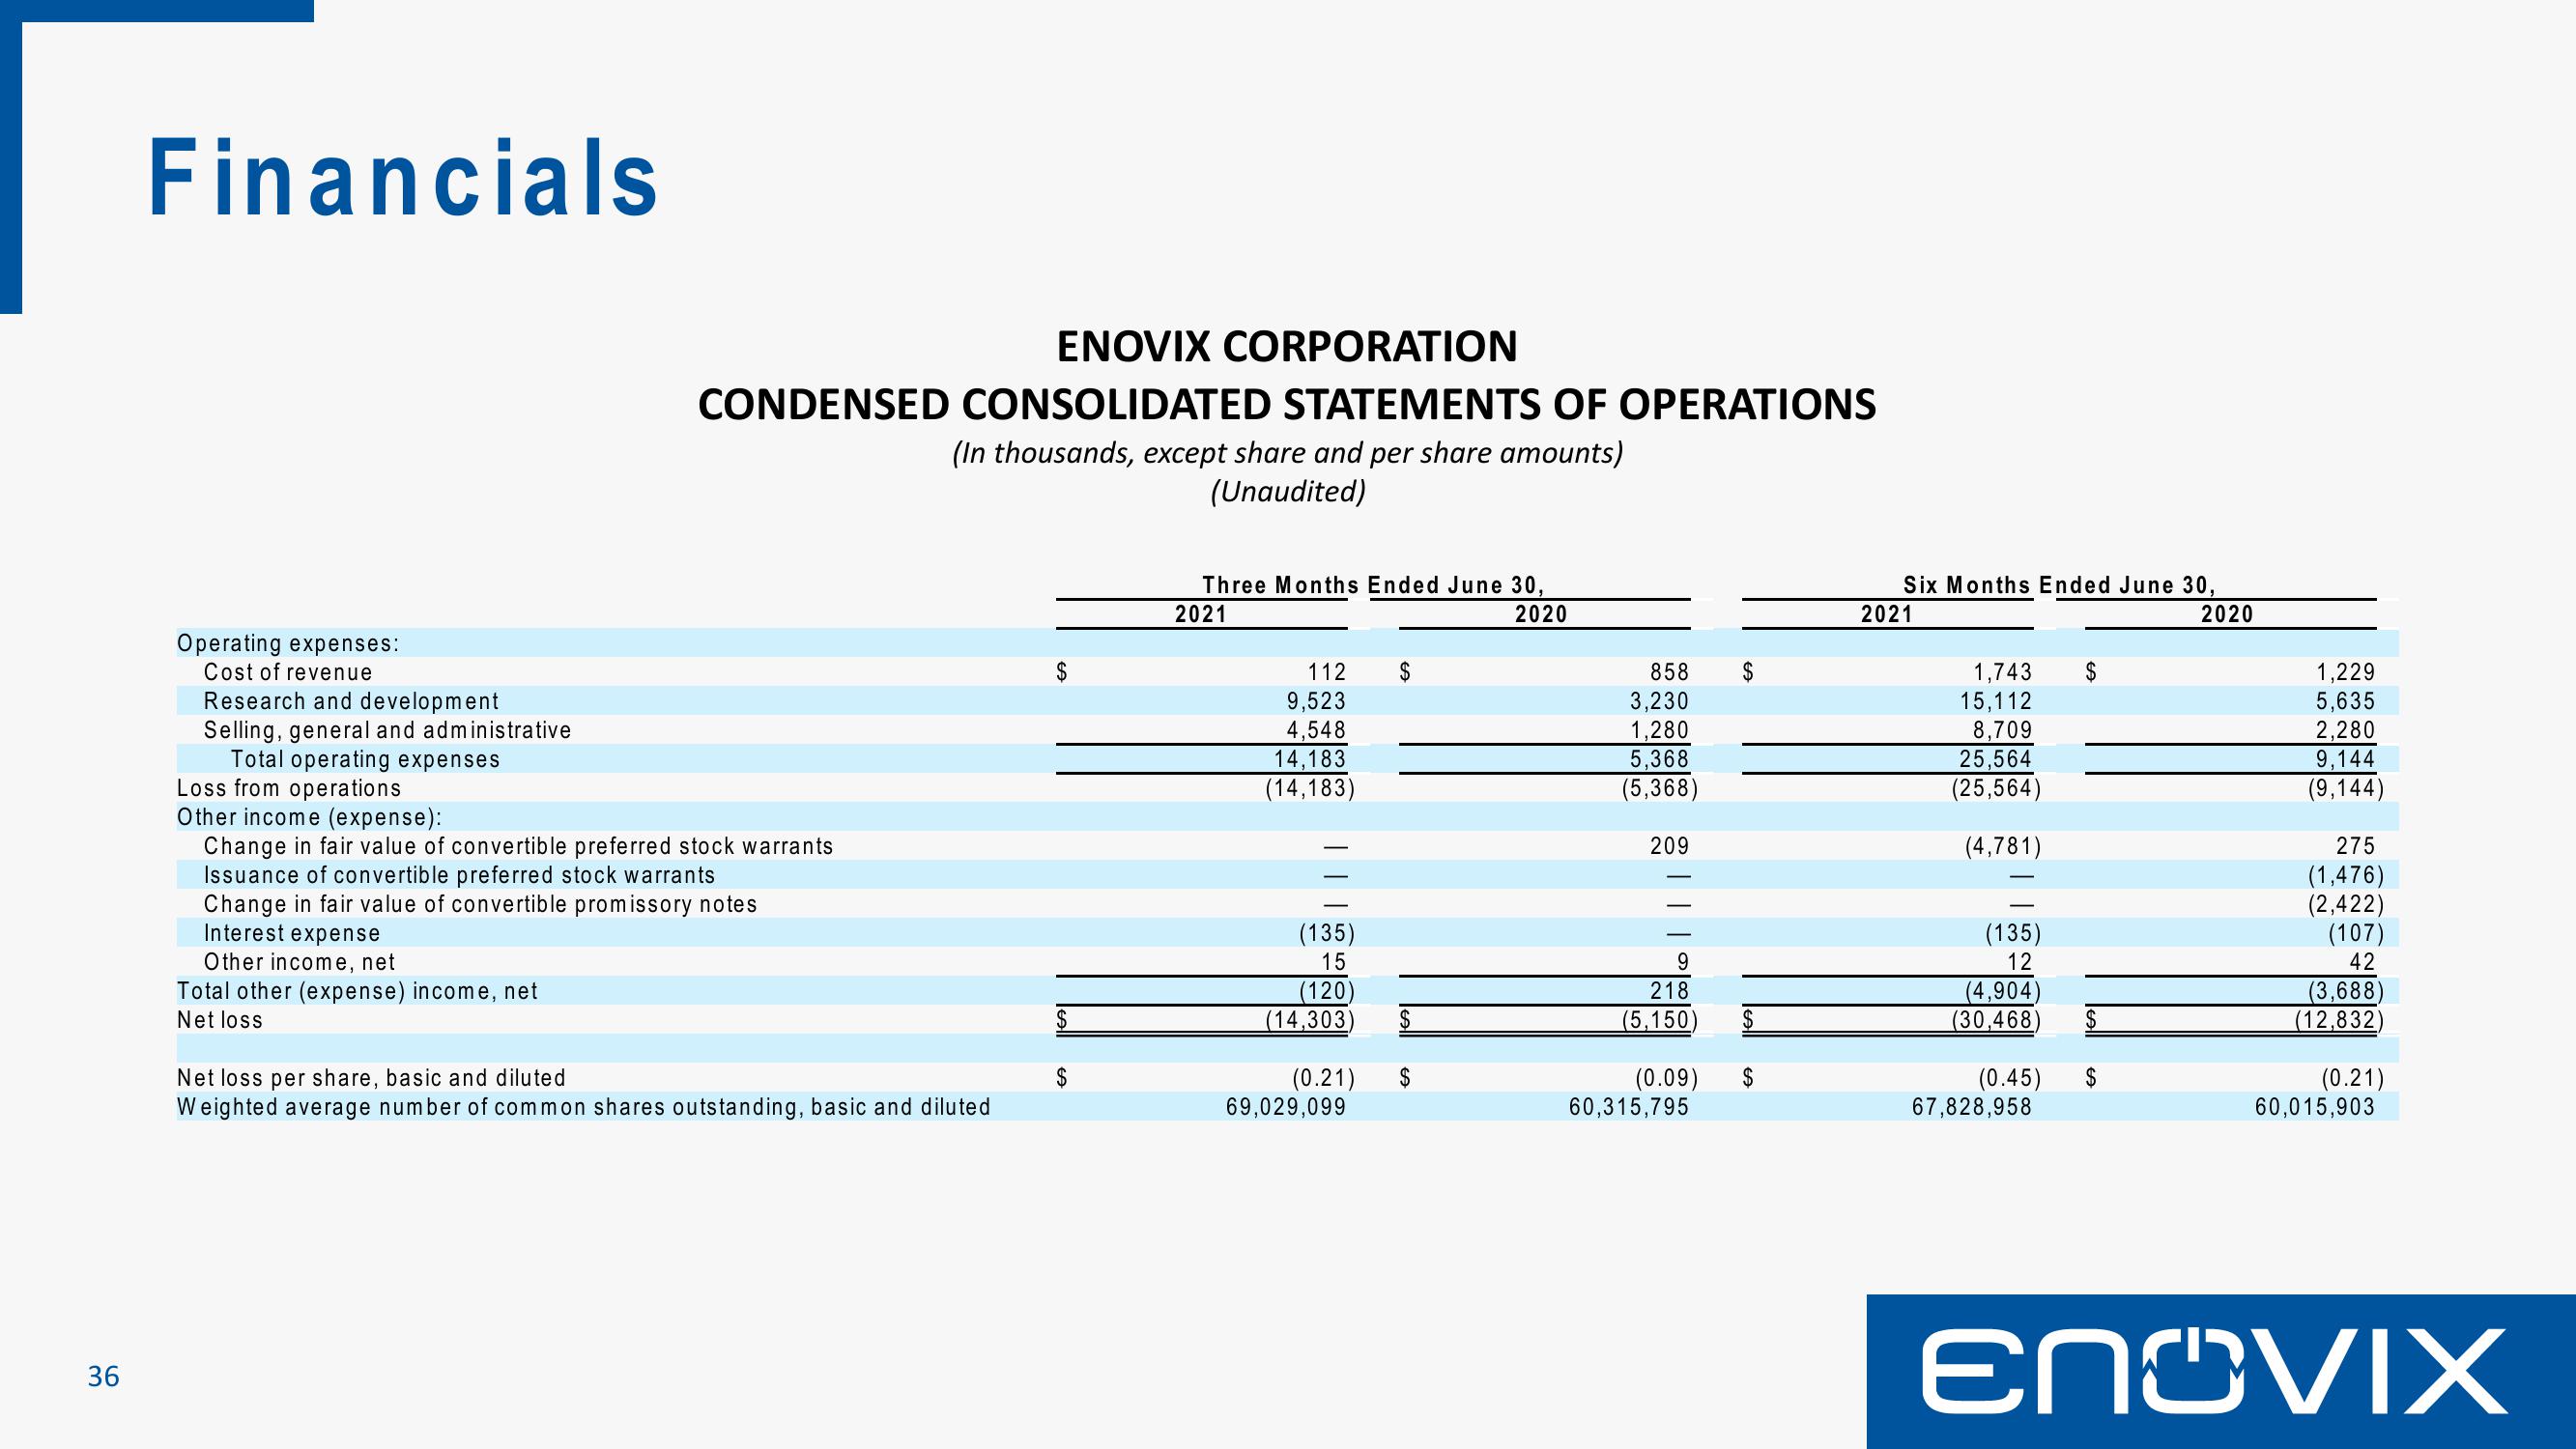
ENOVIX CORPORATION
CONDENSED CONSOLIDATED STATEMENTS OF OPERATIONS
(In thousands, except share and per share amounts)
(Unaudited)
Other income (expense):
Change in fair value of convertible preferred stock warrants
Issuance of convertible preferred stock warrants
Change in fair value of convertible promissory notes
Interest expense
Other income, net
Total other (expense) income, net
Net loss
Net loss per share, basic and diluted
Weighted average number of common shares outstanding, basic and diluted
$
Three Months Ended June 30,
2021
2020
112
9,523
4,548
14,183
(14,183)
(135)
15
(120)
(14,303)
$
69,029,099
$
(0.21) $
858
3,230
1,280
5,368
(5,368)
209
9
218
(5,150)
(0.09)
60,315,795
$
Six Months Ended June 30,
2021
1,743
15,112
8,709
25,564
(25,564)
(4,781)
(135)
12
(4,904)
(30,468)
(0.45)
67,828,958
$
2020
1,229
5,635
2,280
9,144
(9,144)
275
(1,476)
(2,422)
(107)
42
(3,688)
(12,832)
(0.21)
60,015,903
ENOVIXView entire presentation