Innovid SPAC Presentation Deck
12
10
00
8
4
2
24
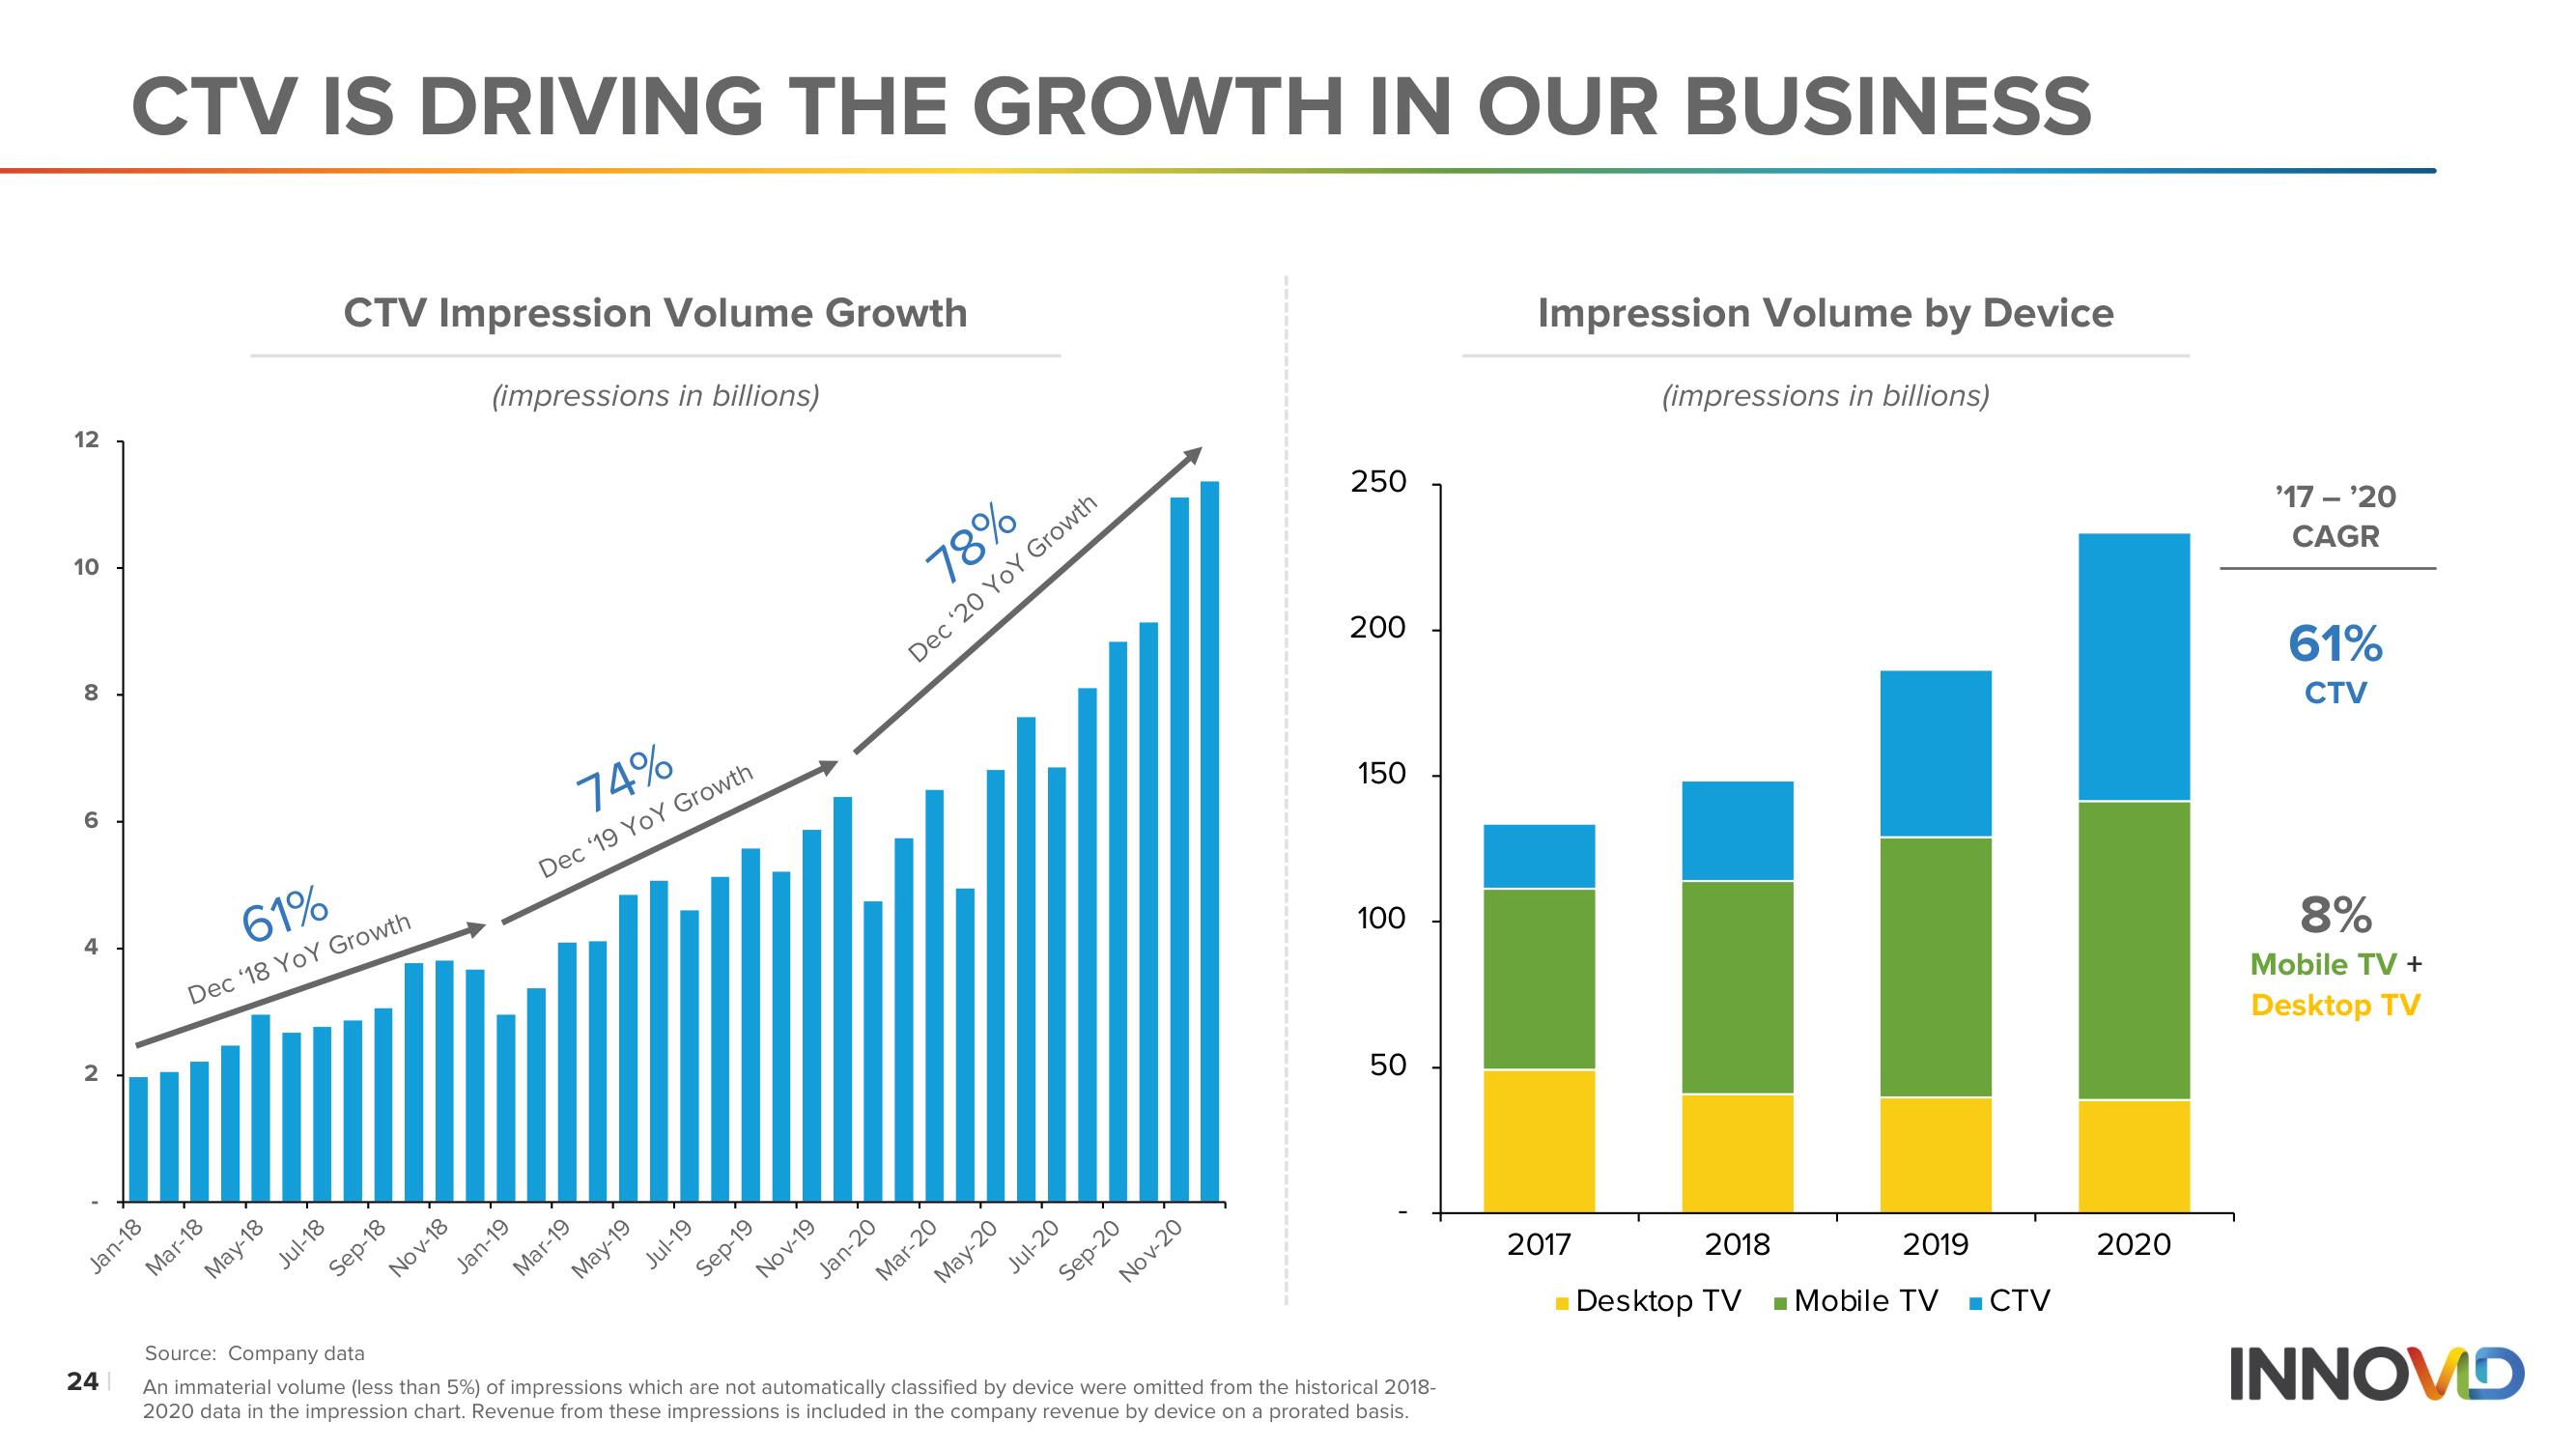
CTV IS DRIVING THE GROWTH IN OUR BUSINESS
Jan-18
61%
Dec '18 YoY Growth
Mar-18
May-18
Jul-18
CTV Impression Volume Growth
Sep-18
Nov-18
(impressions in billions)
74%
Dec '19 YOY Growth
Jan-19
Mar-19
May-19
Jul-19
Sep-19
Nov-19
78%
Dec '20 YOY Growth
Jan-20
Mar-20
May-20
Jul-20
Sep-20
Nov-20
250
200
150
100
50
Source: Company data
An immaterial volume (less than 5%) of impressions which are not automatically classified by device were omitted from the historical 2018-
2020 data in the impression chart. Revenue from these impressions is included in the company revenue by device on a prorated basis.
Impression Volume by Device
2017
(impressions in billions)
2018
Desktop TV
2019
■ Mobile TV ■ CTV
2020
'17-'20
CAGR
61%
CTV
8%
Mobile TV +
Desktop TV
INNOVIDView entire presentation