MoneyLion Results Presentation Deck
Unique Competitive Positioning and Massive TAM
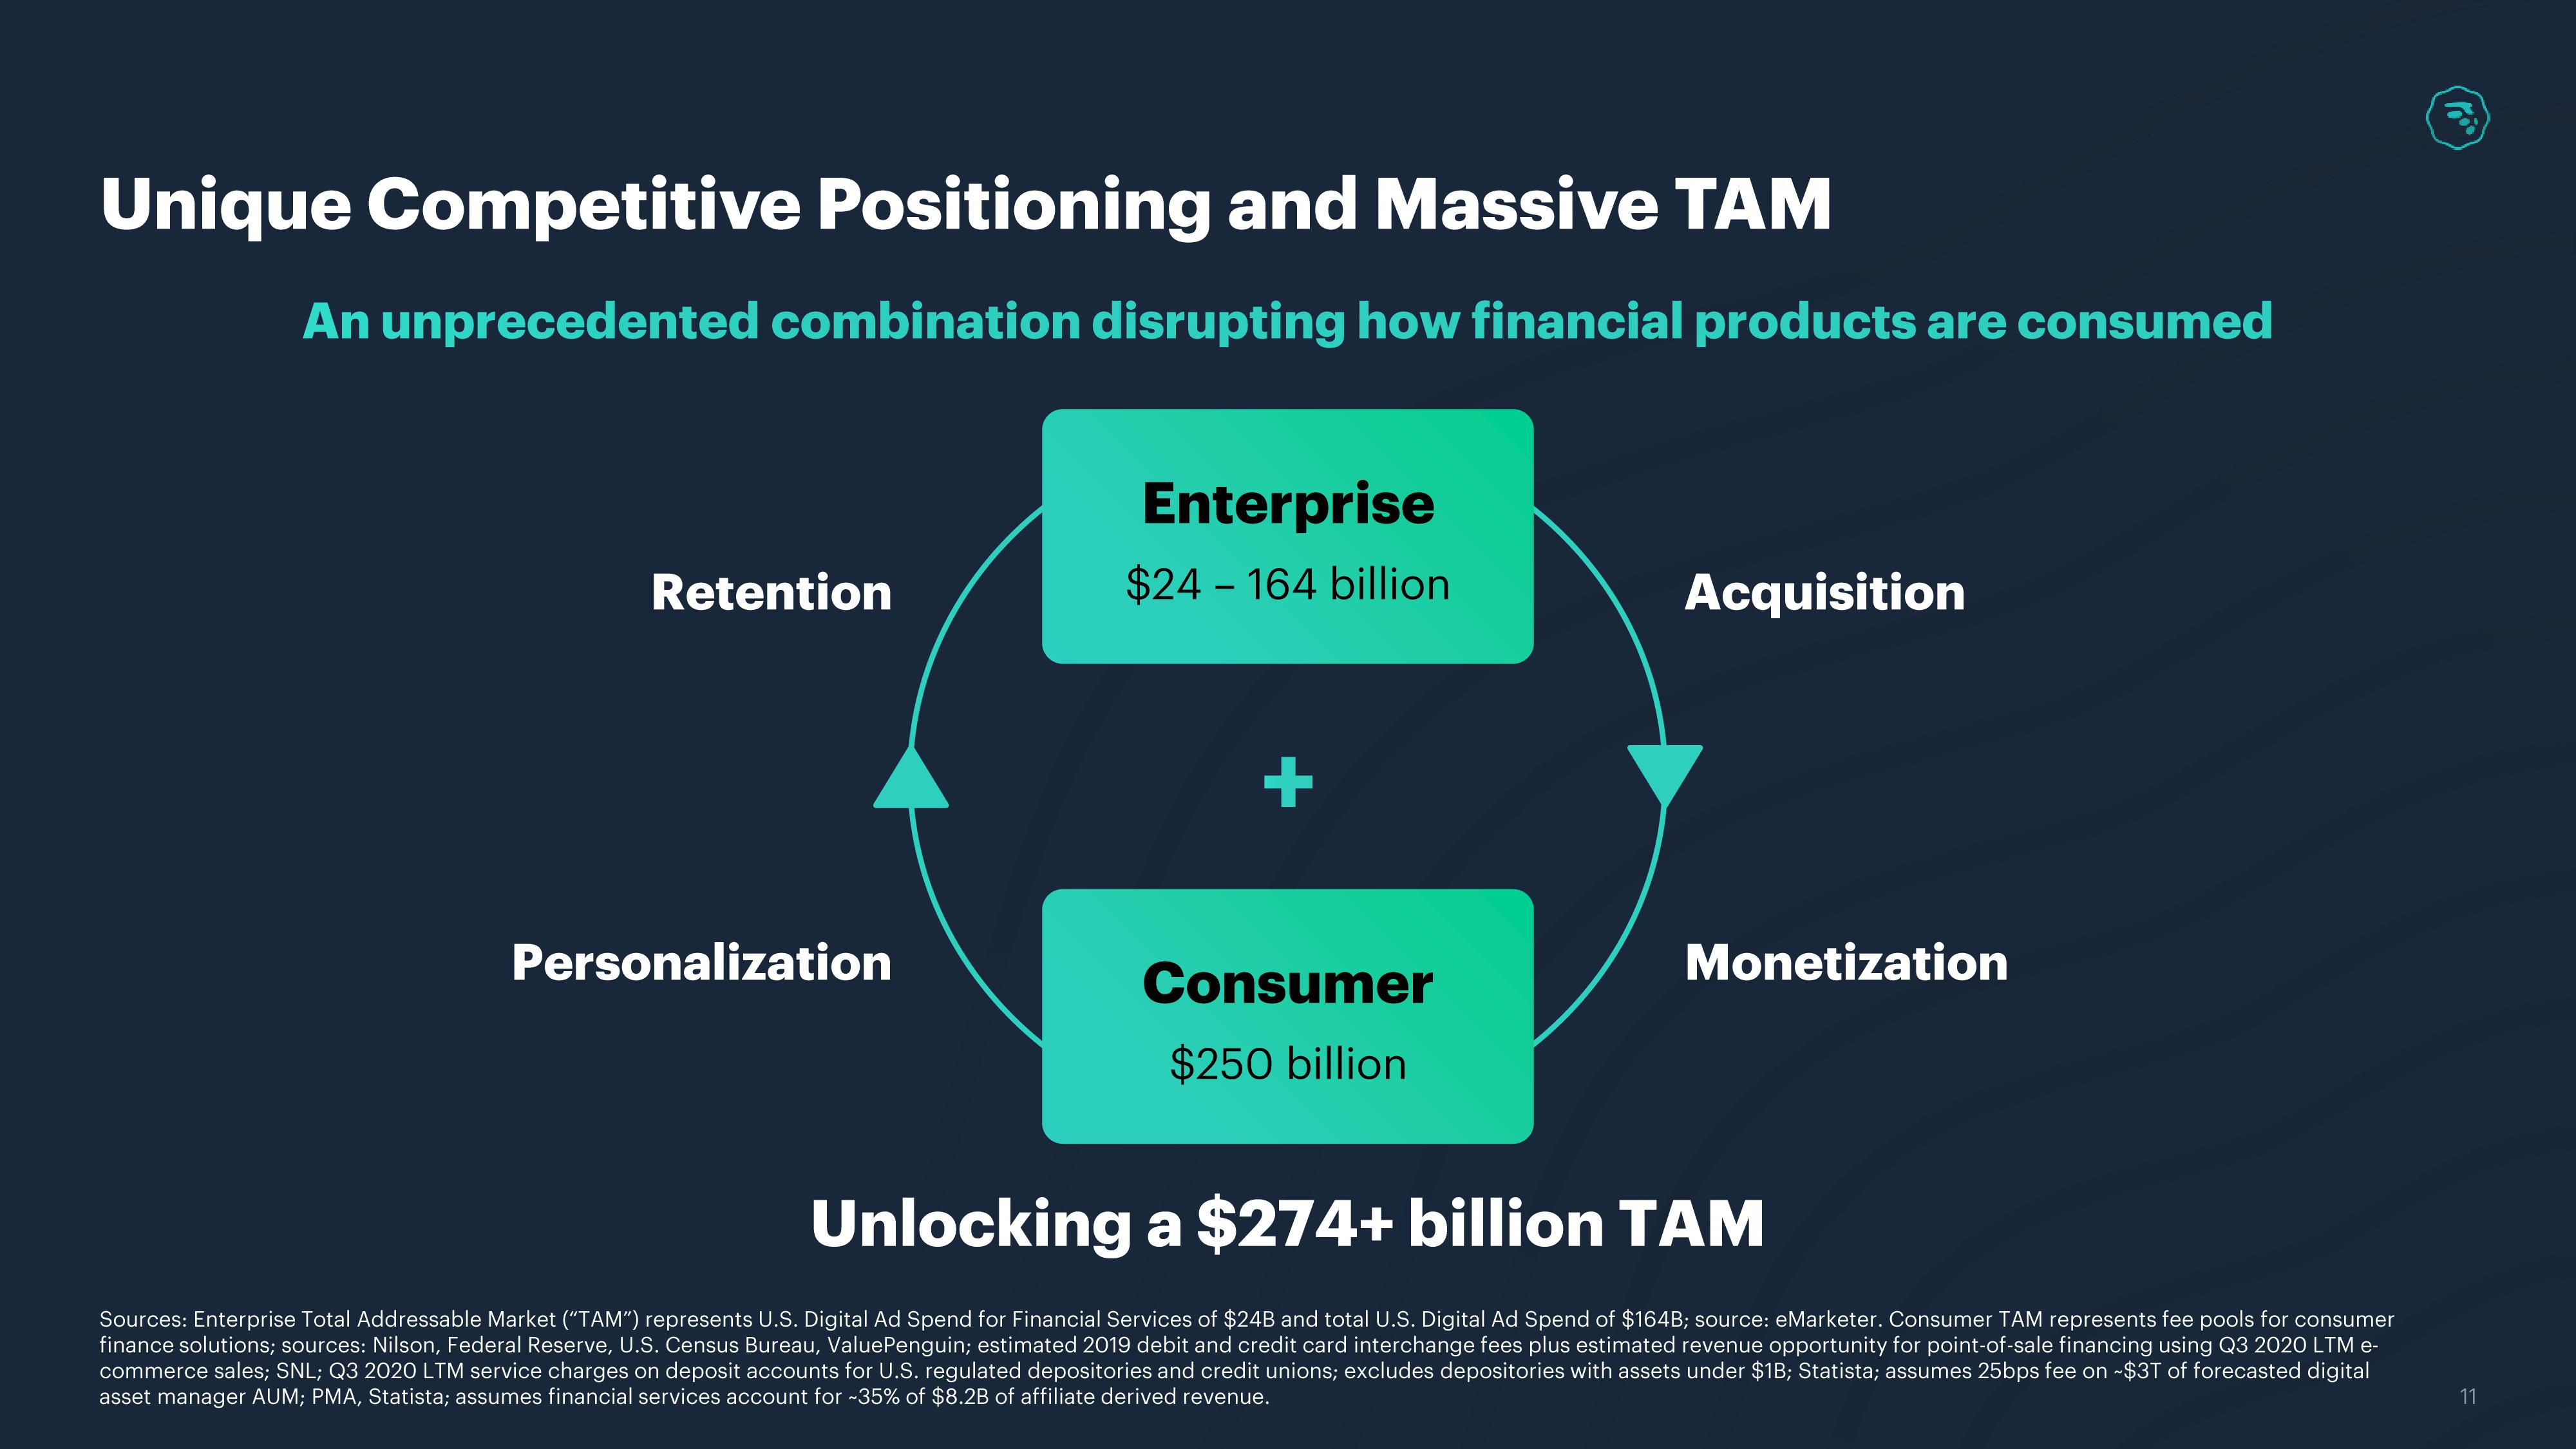
An unprecedented combination disrupting how financial products are consumed
Retention
Personalization
Enterprise
$24-164 billion
+
Consumer
$250 billion
Acquisition
Monetization
Unlocking a $274+ billion TAM
Sources: Enterprise Total Addressable Market ("TAM") represents U.S. Digital Ad Spend for Financial Services of $24B and total U.S. Digital Ad Spend of $164B; source: eMarketer. Consumer TAM represents fee pools for consumer
finance solutions; sources: Nilson, Federal Reserve, U.S. Census Bureau, Value Penguin; estimated 2019 debit and credit card interchange fees plus estimated revenue opportunity for point-of-sale financing using Q3 2020 LTM e-
commerce sales; SNL; Q3 2020 LTM service charges on deposit accounts for U.S. regulated depositories and credit unions; excludes depositories with assets under $1B; Statista; assumes 25bps fee on -$3T of forecasted digital
asset manager AUM; PMA, Statista; assumes financial services account for -35% of $8.2B of affiliate derived revenue.
11View entire presentation