DocGo SPAC Presentation Deck
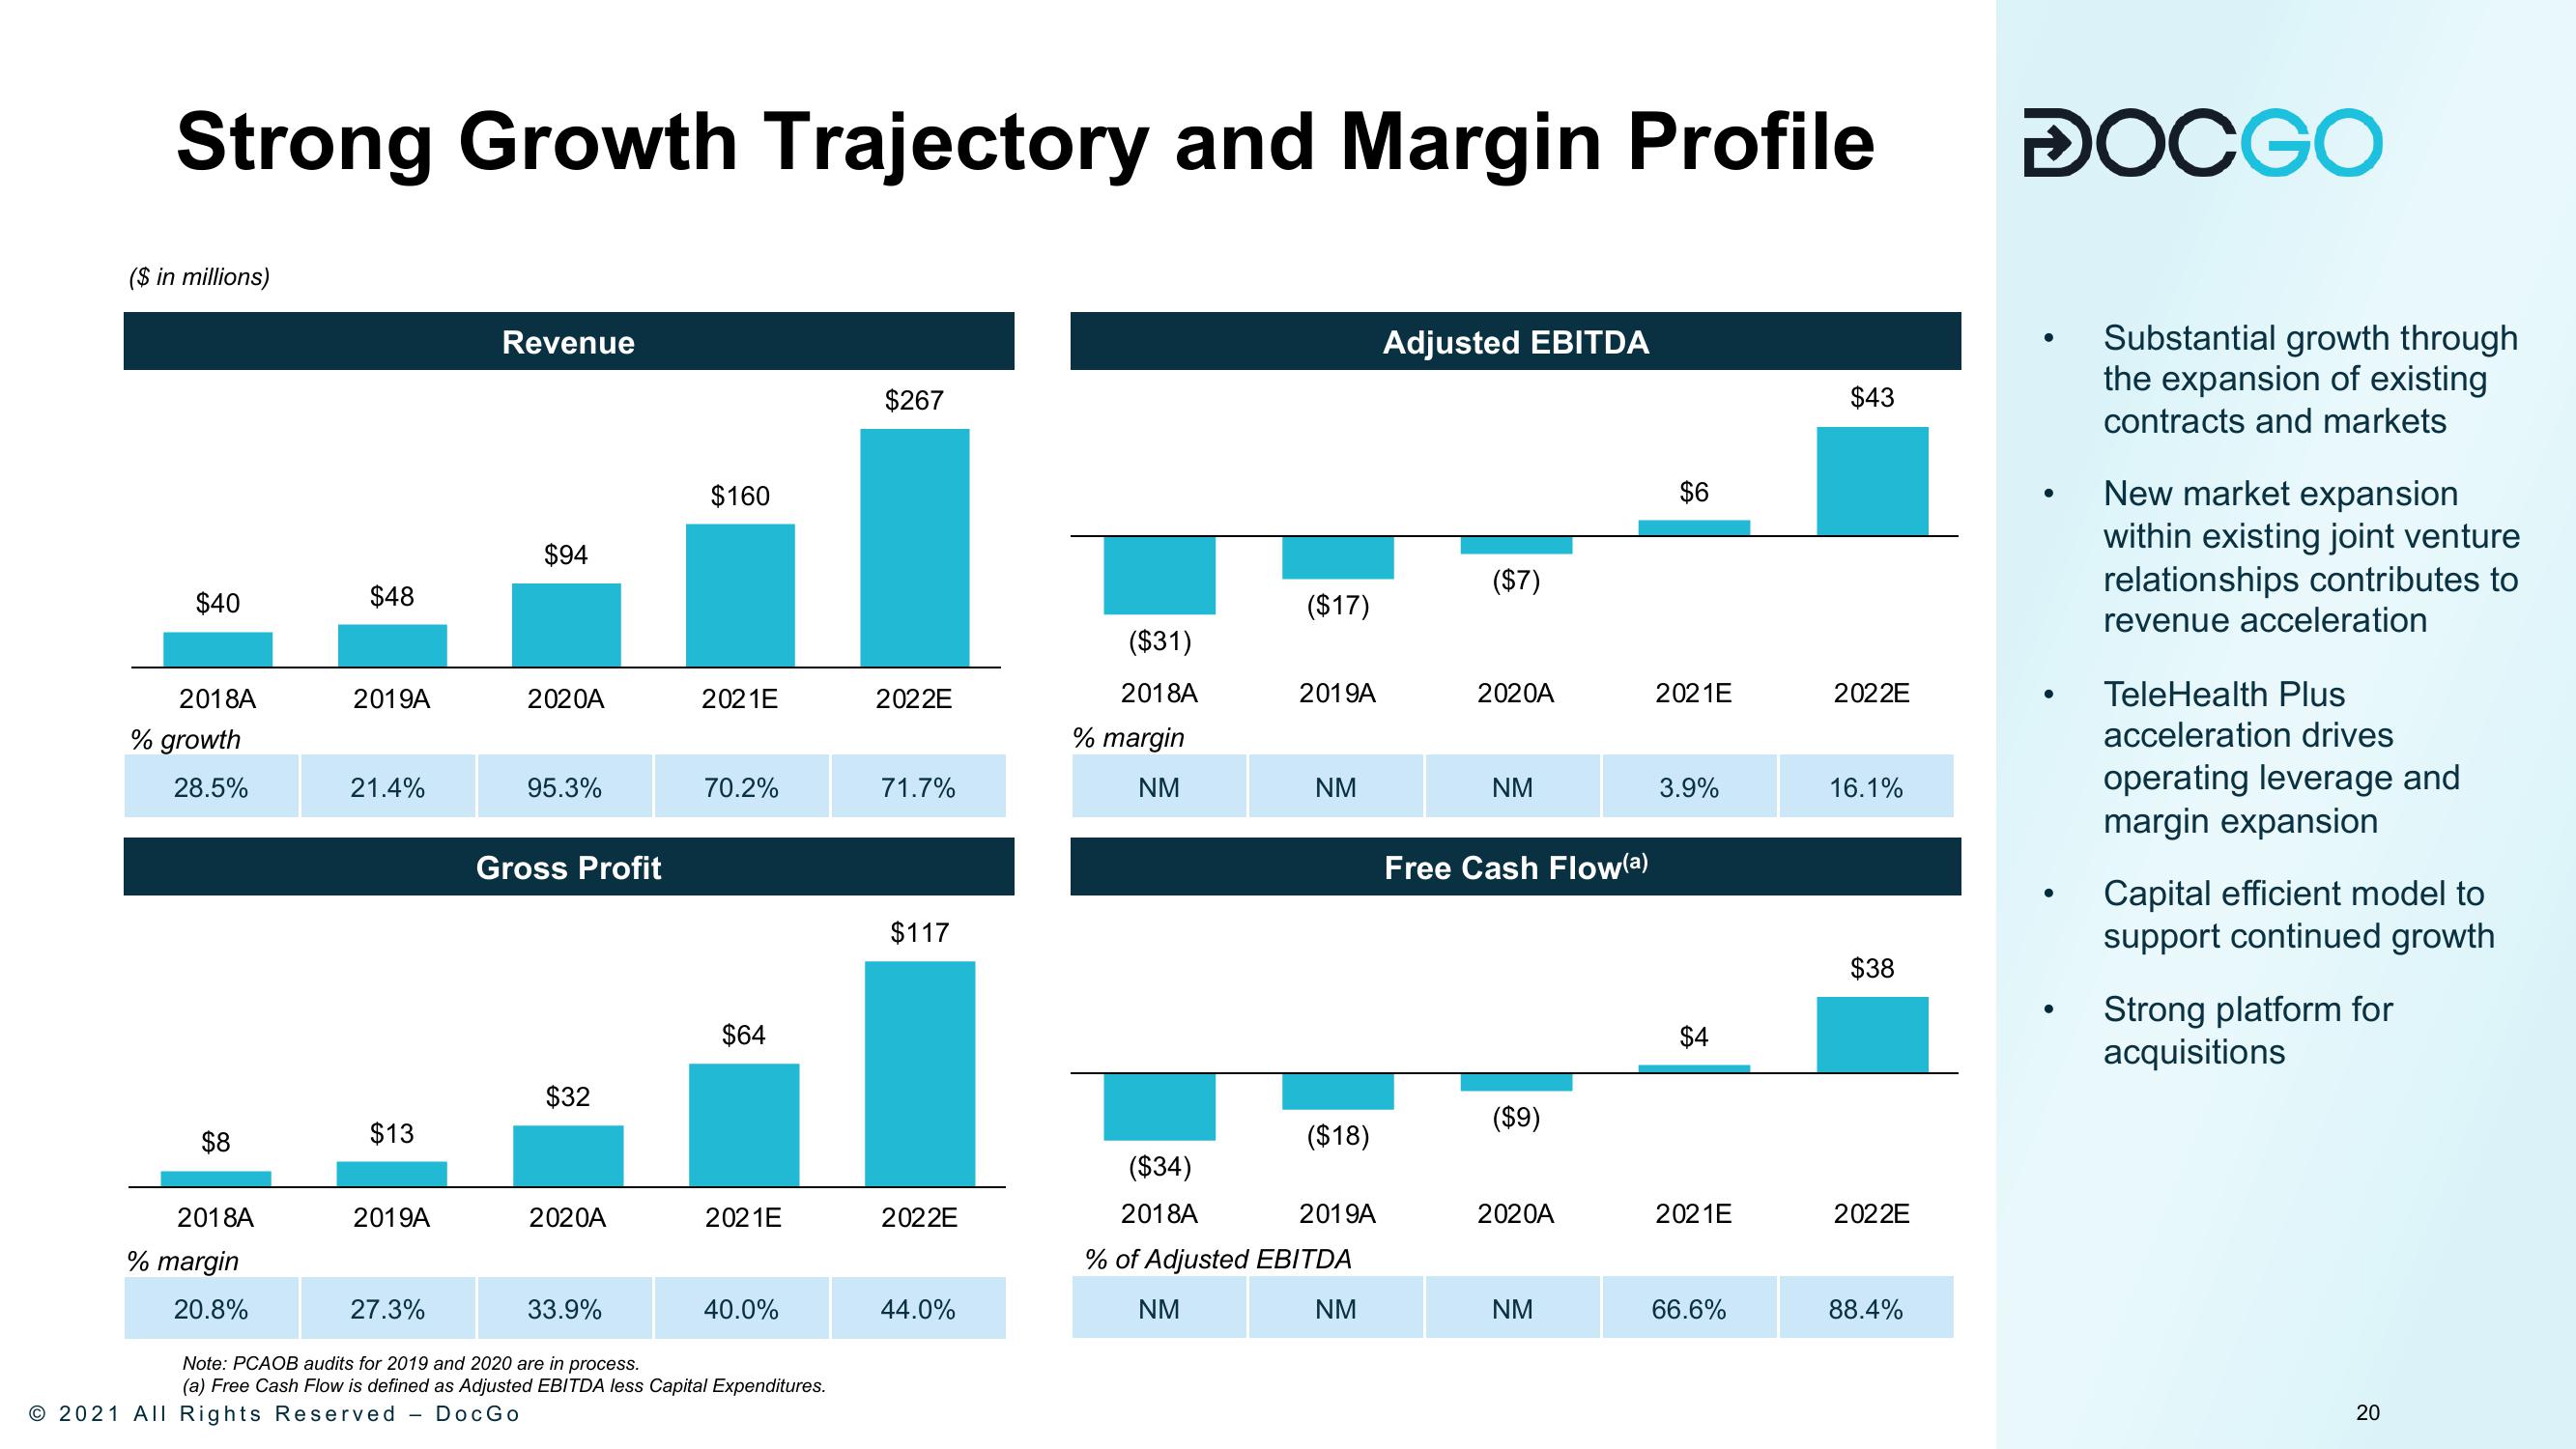
Strong Growth Trajectory and Margin Profile
($ in millions)
$40
2018A
% growth
28.5%
$8
2018A
% margin
20.8%
$48
2019A
21.4%
$13
2019A
27.3%
Revenue
$94
2020A
© 2021 All Rights Reserved - DocGo
95.3%
Gross Profit
$32
2020A
33.9%
$160
2021E
70.2%
$64
2021E
40.0%
Note: PCAOB audits for 2019 and 2020 are in process.
(a) Free Cash Flow is defined as Adjusted EBITDA less Capital Expenditures.
$267
2022E
71.7%
$117
2022E
44.0%
($31)
2018A
% margin
NM
($17)
2019A
NM
($18)
($34)
2018A
2019A
% of Adjusted EBITDA
NM
NM
Adjusted EBITDA
($7)
2020A
NM
Free Cash Flow(a)
($9)
2020A
NM
$6
2021E
3.9%
$4
2021E
66.6%
$43
2022E
16.1%
$38
2022E
88.4%
DOCGO
●
●
●
Substantial growth through
the expansion of existing
contracts and markets
New market expansion
within existing joint venture
relationships contributes to
revenue acceleration
TeleHealth Plus
acceleration drives
operating leverage and
margin expansion
Capital efficient model to
support continued growth
Strong platform for
acquisitions
20View entire presentation