Comcast Investor Presentation Deck
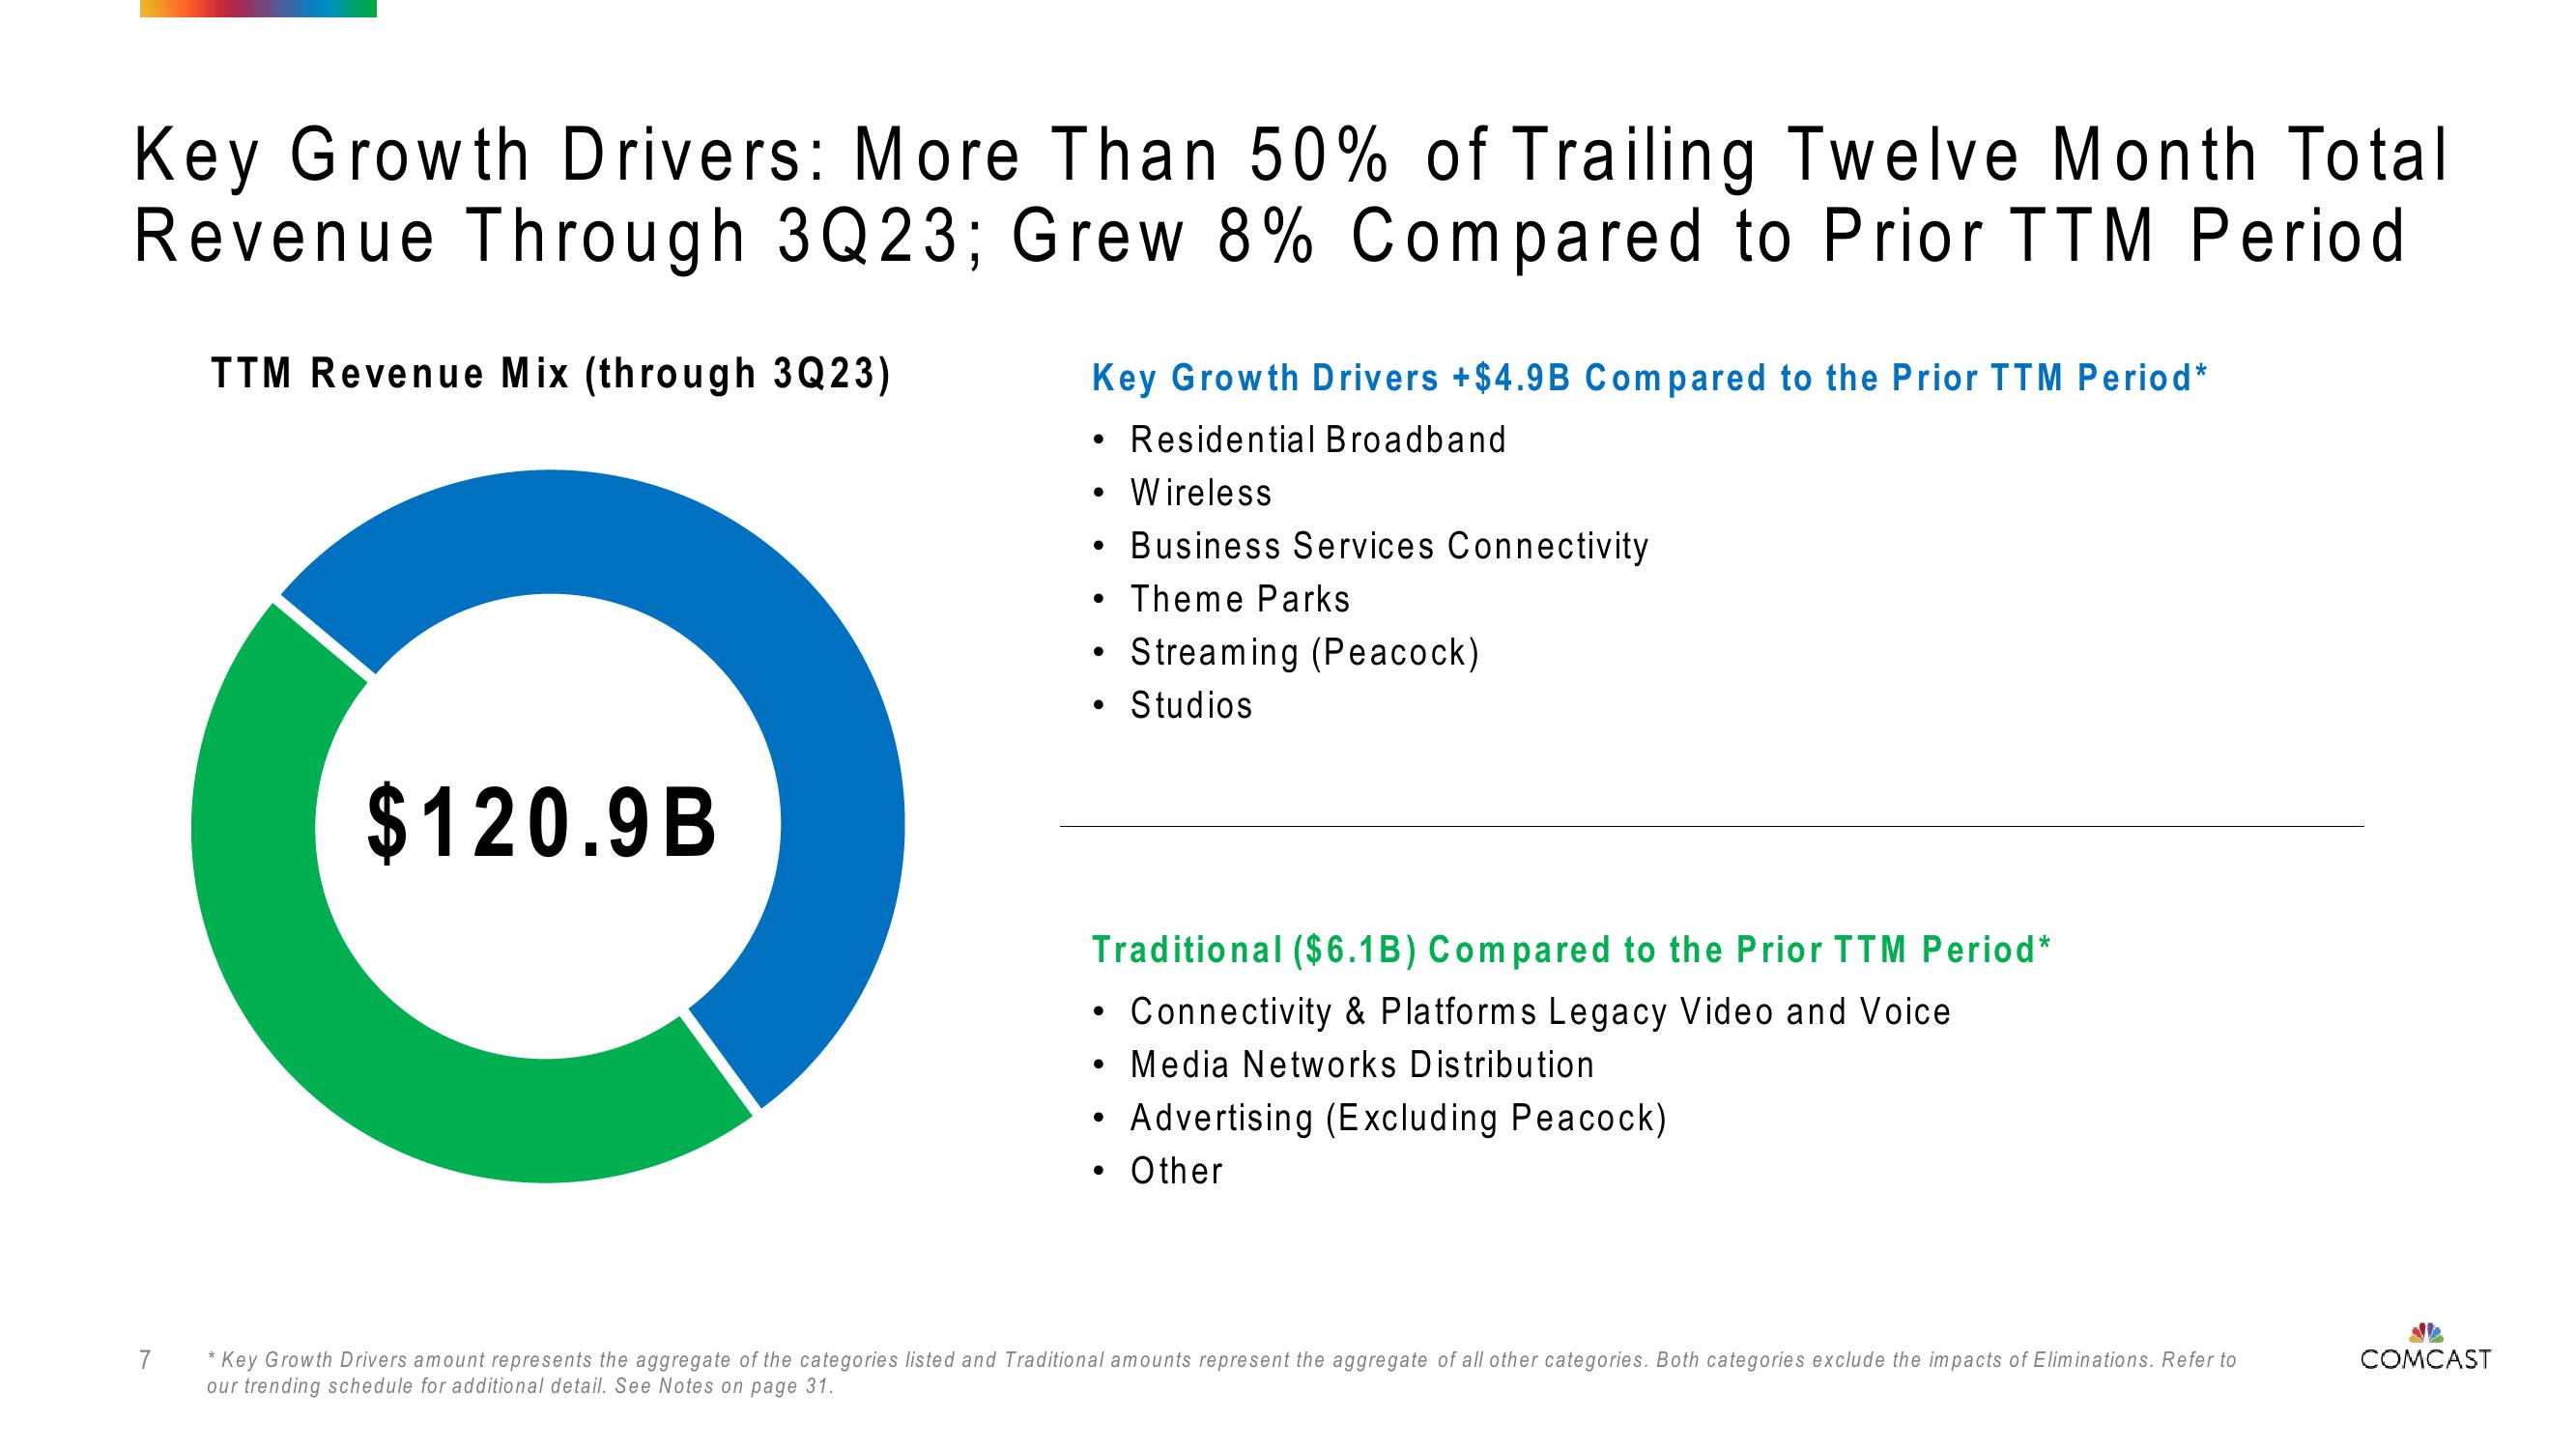
Key Growth Drivers: More Than 50% of Trailing Twelve Month Total
Revenue Through 3Q23; Grew 8% Compared to Prior TTM Period
7
TTM Revenue Mix (through 3Q23)
$120.9B
Key Growth Drivers +$4.9B Compared to the Prior TTM Period*
• Residential Broadband
●
●
●
●
●
Wireless
Business Services Connectivity
Theme Parks
Traditional ($6.1B) Compared to the Prior TTM Period*
Connectivity & Platforms Legacy Video and Voice
Media Networks Distribution
Advertising (Excluding Peacock)
Other
●
Streaming (Peacock)
Studios
*Key Growth Drivers amount represents the aggregate of the categories listed and Traditional amounts represent the aggregate of all other categories. Both categories exclude the impacts of Eliminations. Refer to
our trending schedule for additional detail. See Notes on page 31.
COMCASTView entire presentation