Tudor, Pickering, Holt & Co Investment Banking
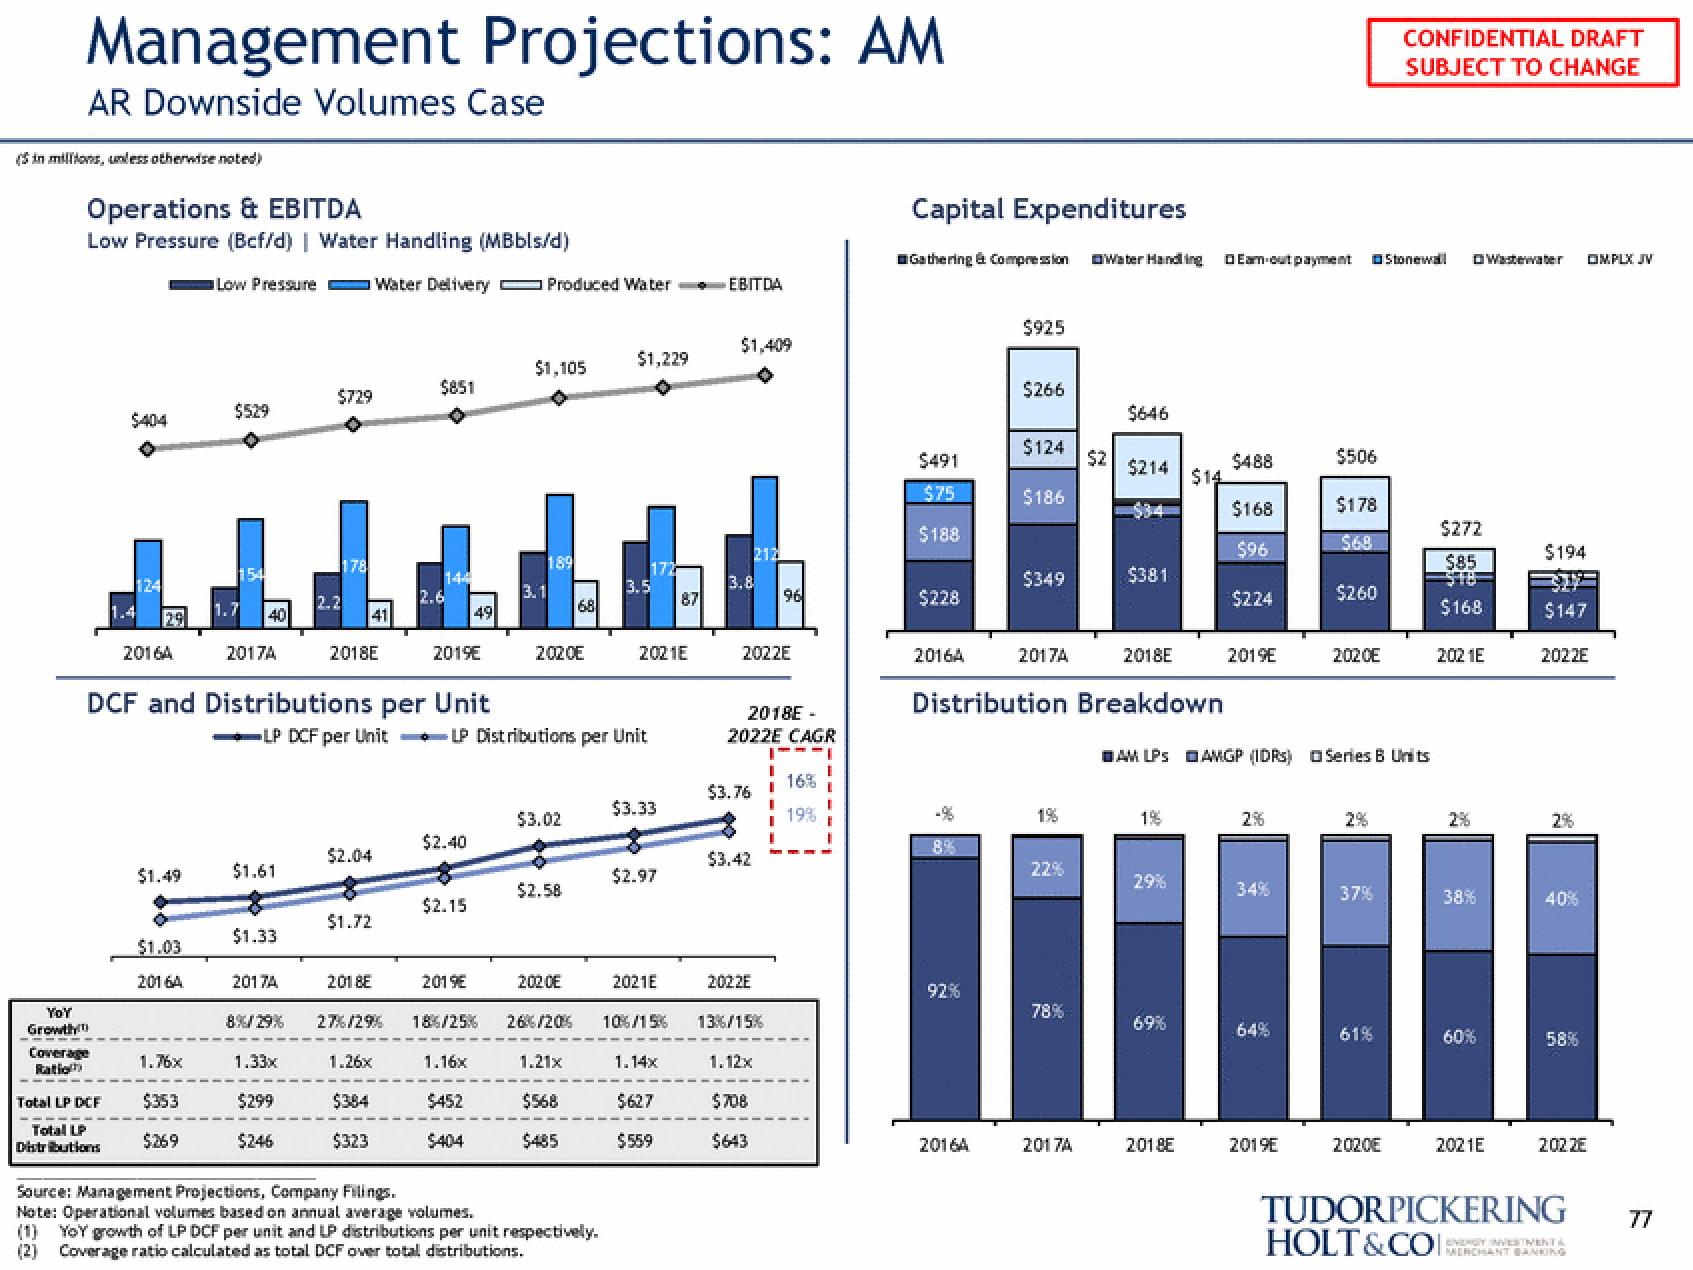
Management Projections: AM
AR Downside Volumes Case
(in millions, unless otherwise noted)
Operations & EBITDA
Low Pressure (Bcf/d) | Water Handling (MBbls/d)
YOY
Growth
Coverage
1.4
Total LP DCF
Total LP
Distributions
124
2016A
$1.49
$1.03
20164
1.76x
Low Pressure Water Delivery Produced Water EBITDA
$353
$269
$529
154
40
2017A
$1.61
$1.33
DCF and Distributions per Unit
LP DCF per Unit
T
1.33x
$729
$299
$246
178
41
2018E
$2.04
2017A
2018E
8%/29% 27%/29%
1.26x
$384
$323
$1.72
$851
2.6
2019E
$2.40
49
$2.15
2019E
18%/25%
1.16x
$452
$404
$1,105
3.1
189
LP Distributions per Unit
2020E
$3.02
$2.58
202.0E
26%/20%
68
1.21x
$568
$485
$1,229
Source: Management Projections, Company Filings.
Note: Operational volumes based on annual average volumes.
YoY growth of LP DCF per unit and LP distributions per unit respectively.
(2) Coverage ratio calculated as total DCF over total distributions.
172
3.5
2021E
$3.33
$2.97
2021E
10%/15%
87
1.14x
$627
$559
T
$1,409
3.8
2022E
2018E-
2022E CAGR
$3.76
$3.42
2022E
13%/15%
1.12x
$708
$643
96
I
I
I
16% I
19% I
Capital Expenditures
Gathering & Compression Water Handling DEam-out payment
$491
$75
$188
$228
2016A
92%
$925
2016A
$266
$124
$186
$349
2017A
22%
78%
$2
2017A
$646
Distribution Breakdown
$214
$381
2018E
1%
29%
$14
69%
2018E
$488
$168
$96
$224
2019E
2%
AM LPS AMGP (IDRS) □Series B Units
34%
64%
$506
2019E
$178
$68
$260
2020E
2%
37%
61%
CONFIDENTIAL DRAFT
SUBJECT TO CHANGE
2020E
Stonewall
$272
$85
518-
$168
2021E
2%
38%
60%
Wastewater □MPLX JV
2021E
$194
$147
2022E
2%
40%
58%
202 ZE
TUDORPICKERING
HOLT&COCHANT BANKING
77View entire presentation