Hubspot Investor Day Presentation Deck
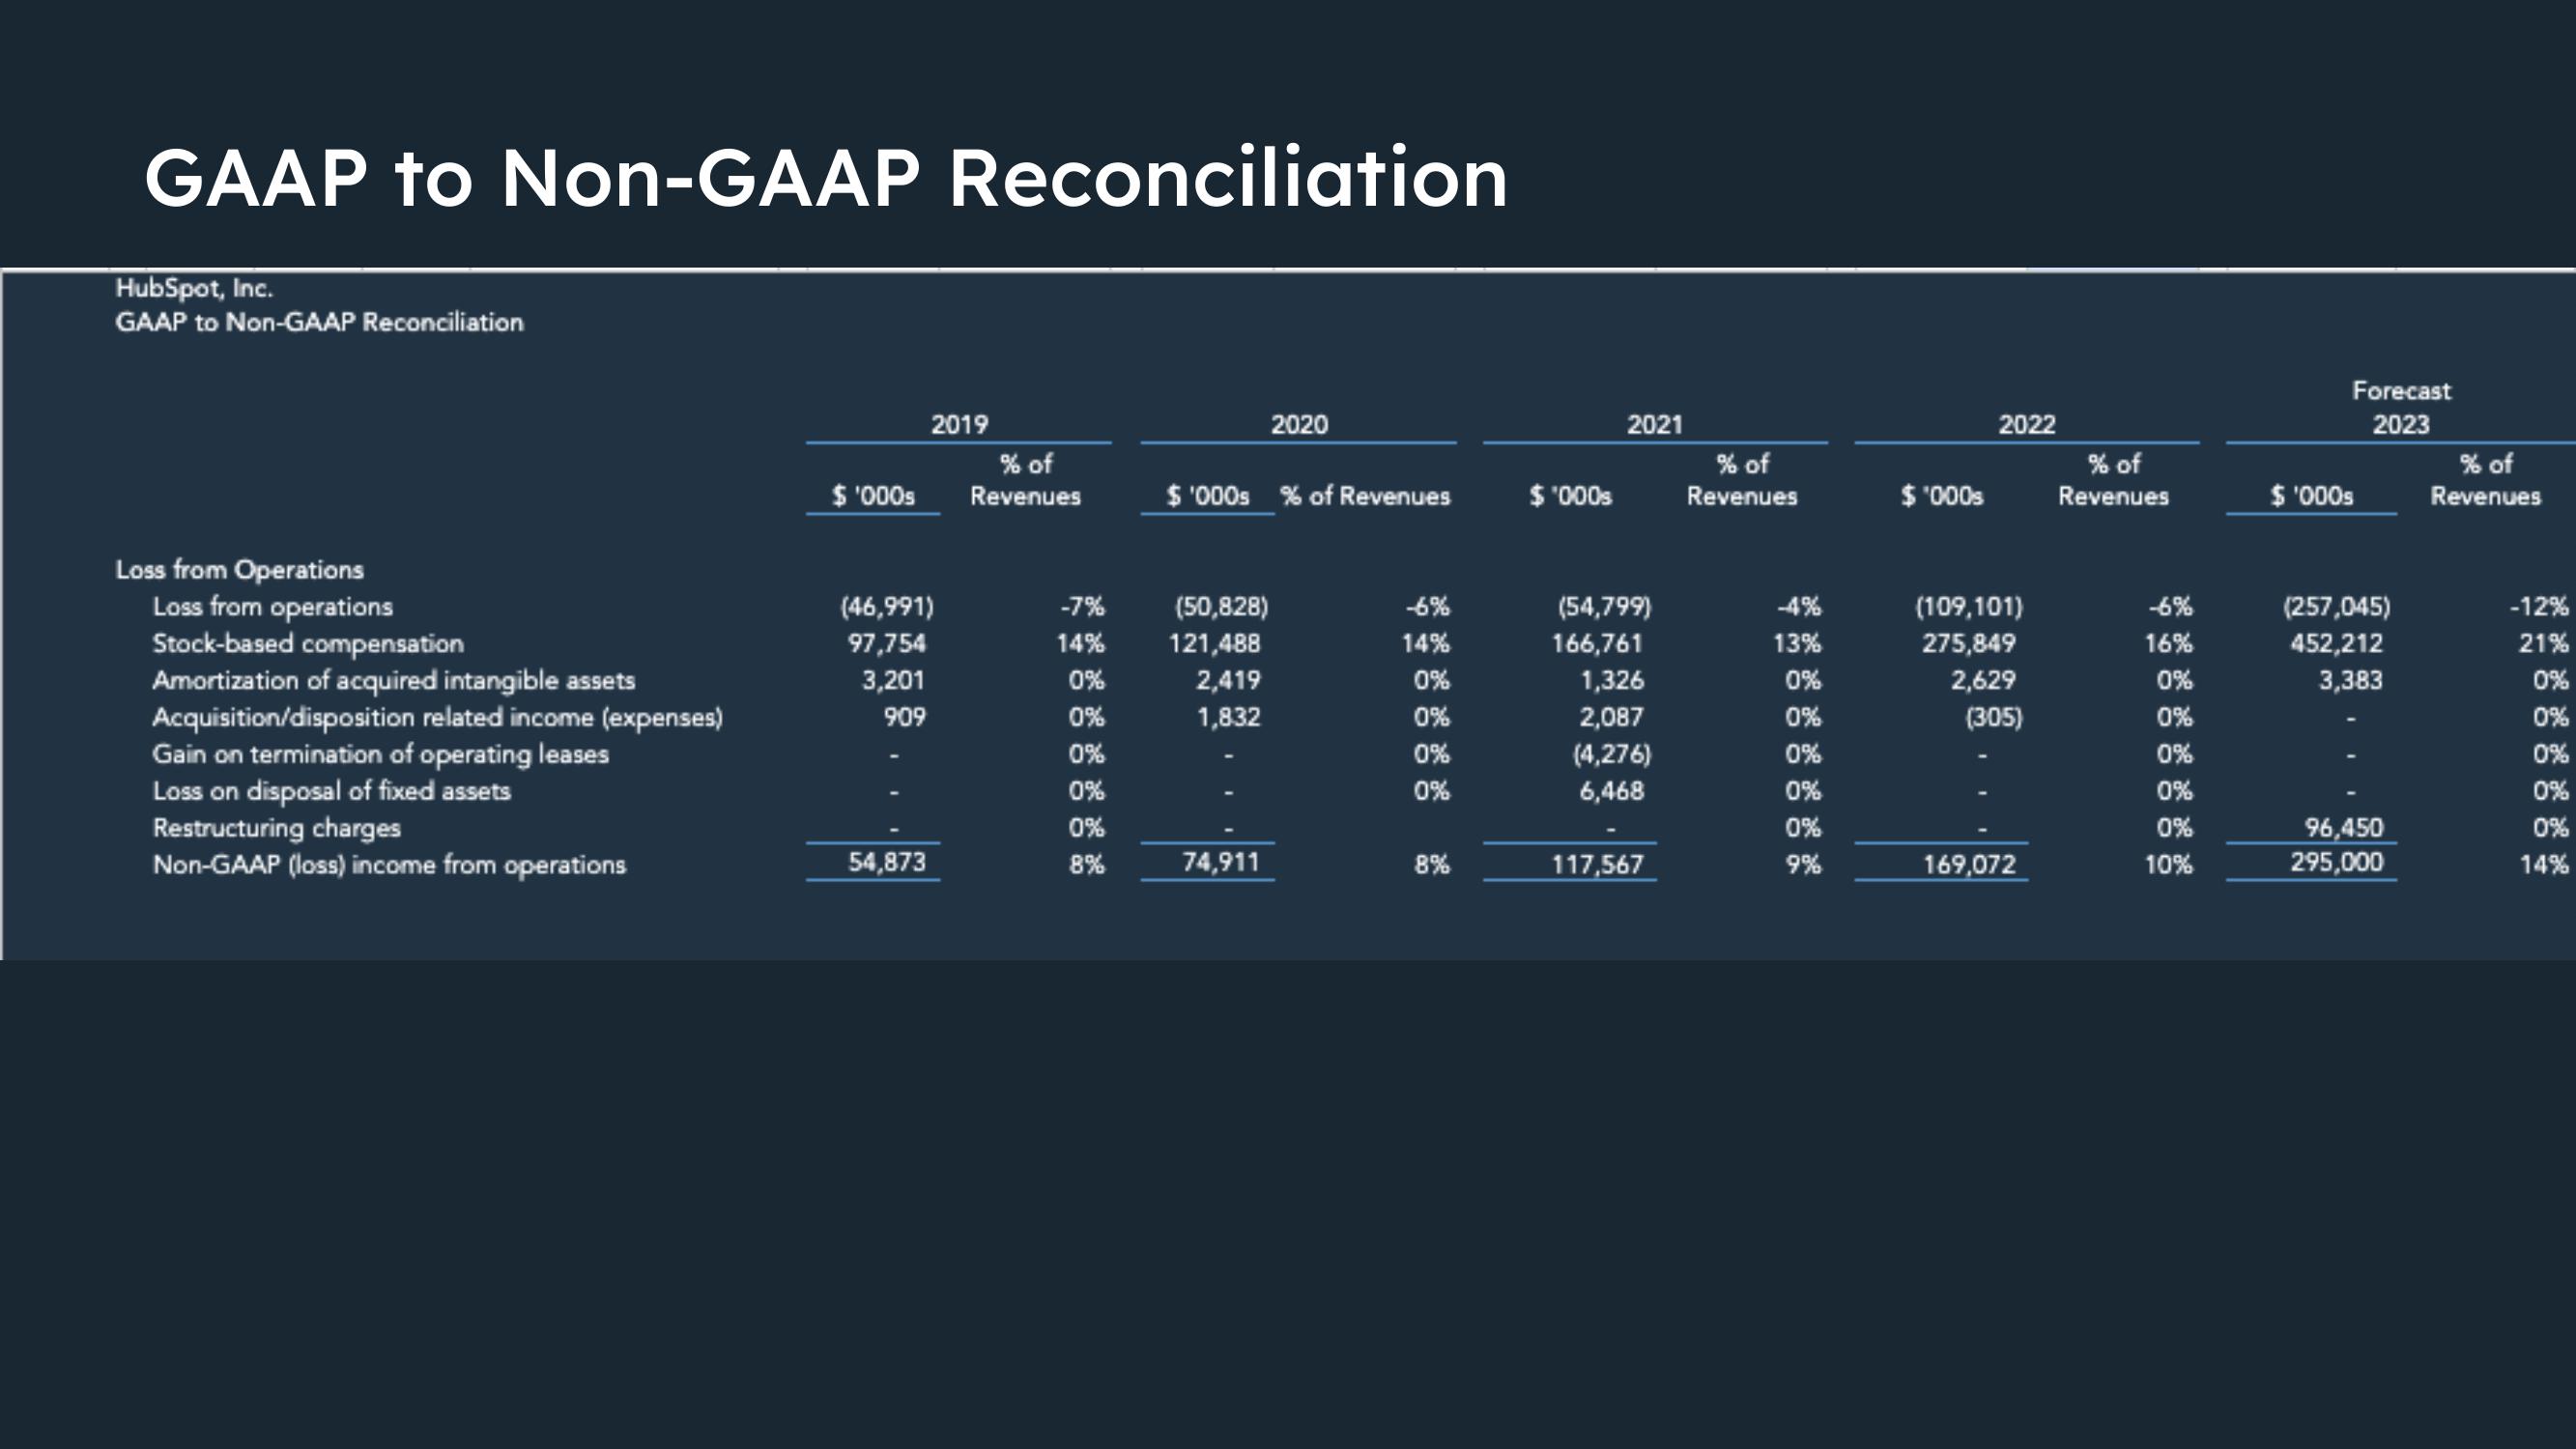
GAAP to Non-GAAP Reconciliation
HubSpot, Inc.
GAAP to Non-GAAP Reconciliation
Loss from Operations
Loss from operations
Stock-based compensation
Amortization of acquired intangible assets
Acquisition/disposition related income (expenses)
Gain on termination of operating leases
Loss on disposal of fixed assets
Restructuring charges
Non-GAAP (loss) income from operations
$ '000s
2019
(46,991)
97,754
3,201
909
54,873
% of
Revenues
-7%
14%
0%
0%
0%
0%
0%
8%
$'000s % of Revenues
(50,828)
121,488
2,419
1,832
2020
74,911
-6%
14%
0%
0%
0%
0%
8%
$ '000s
2021
(54,799)
166,761
1,326
2,087
(4,276)
6,468
117,567
% of
Revenues
-4%
13%
0%
0%
0%
0%
0%
9%
$ '000s
2022
(109,101)
275,849
2,629
(305)
169,072
% of
Revenues
-6%
16%
0%
0%
0%
0%
0%
10%
Forecast
2023
$'000s
(257,045)
452,212
3,383
96,450
295,000
% of
Revenues
-12%
21%
0%
0%
0%
0%
0%
14%View entire presentation