Hydrafacial Results Presentation Deck
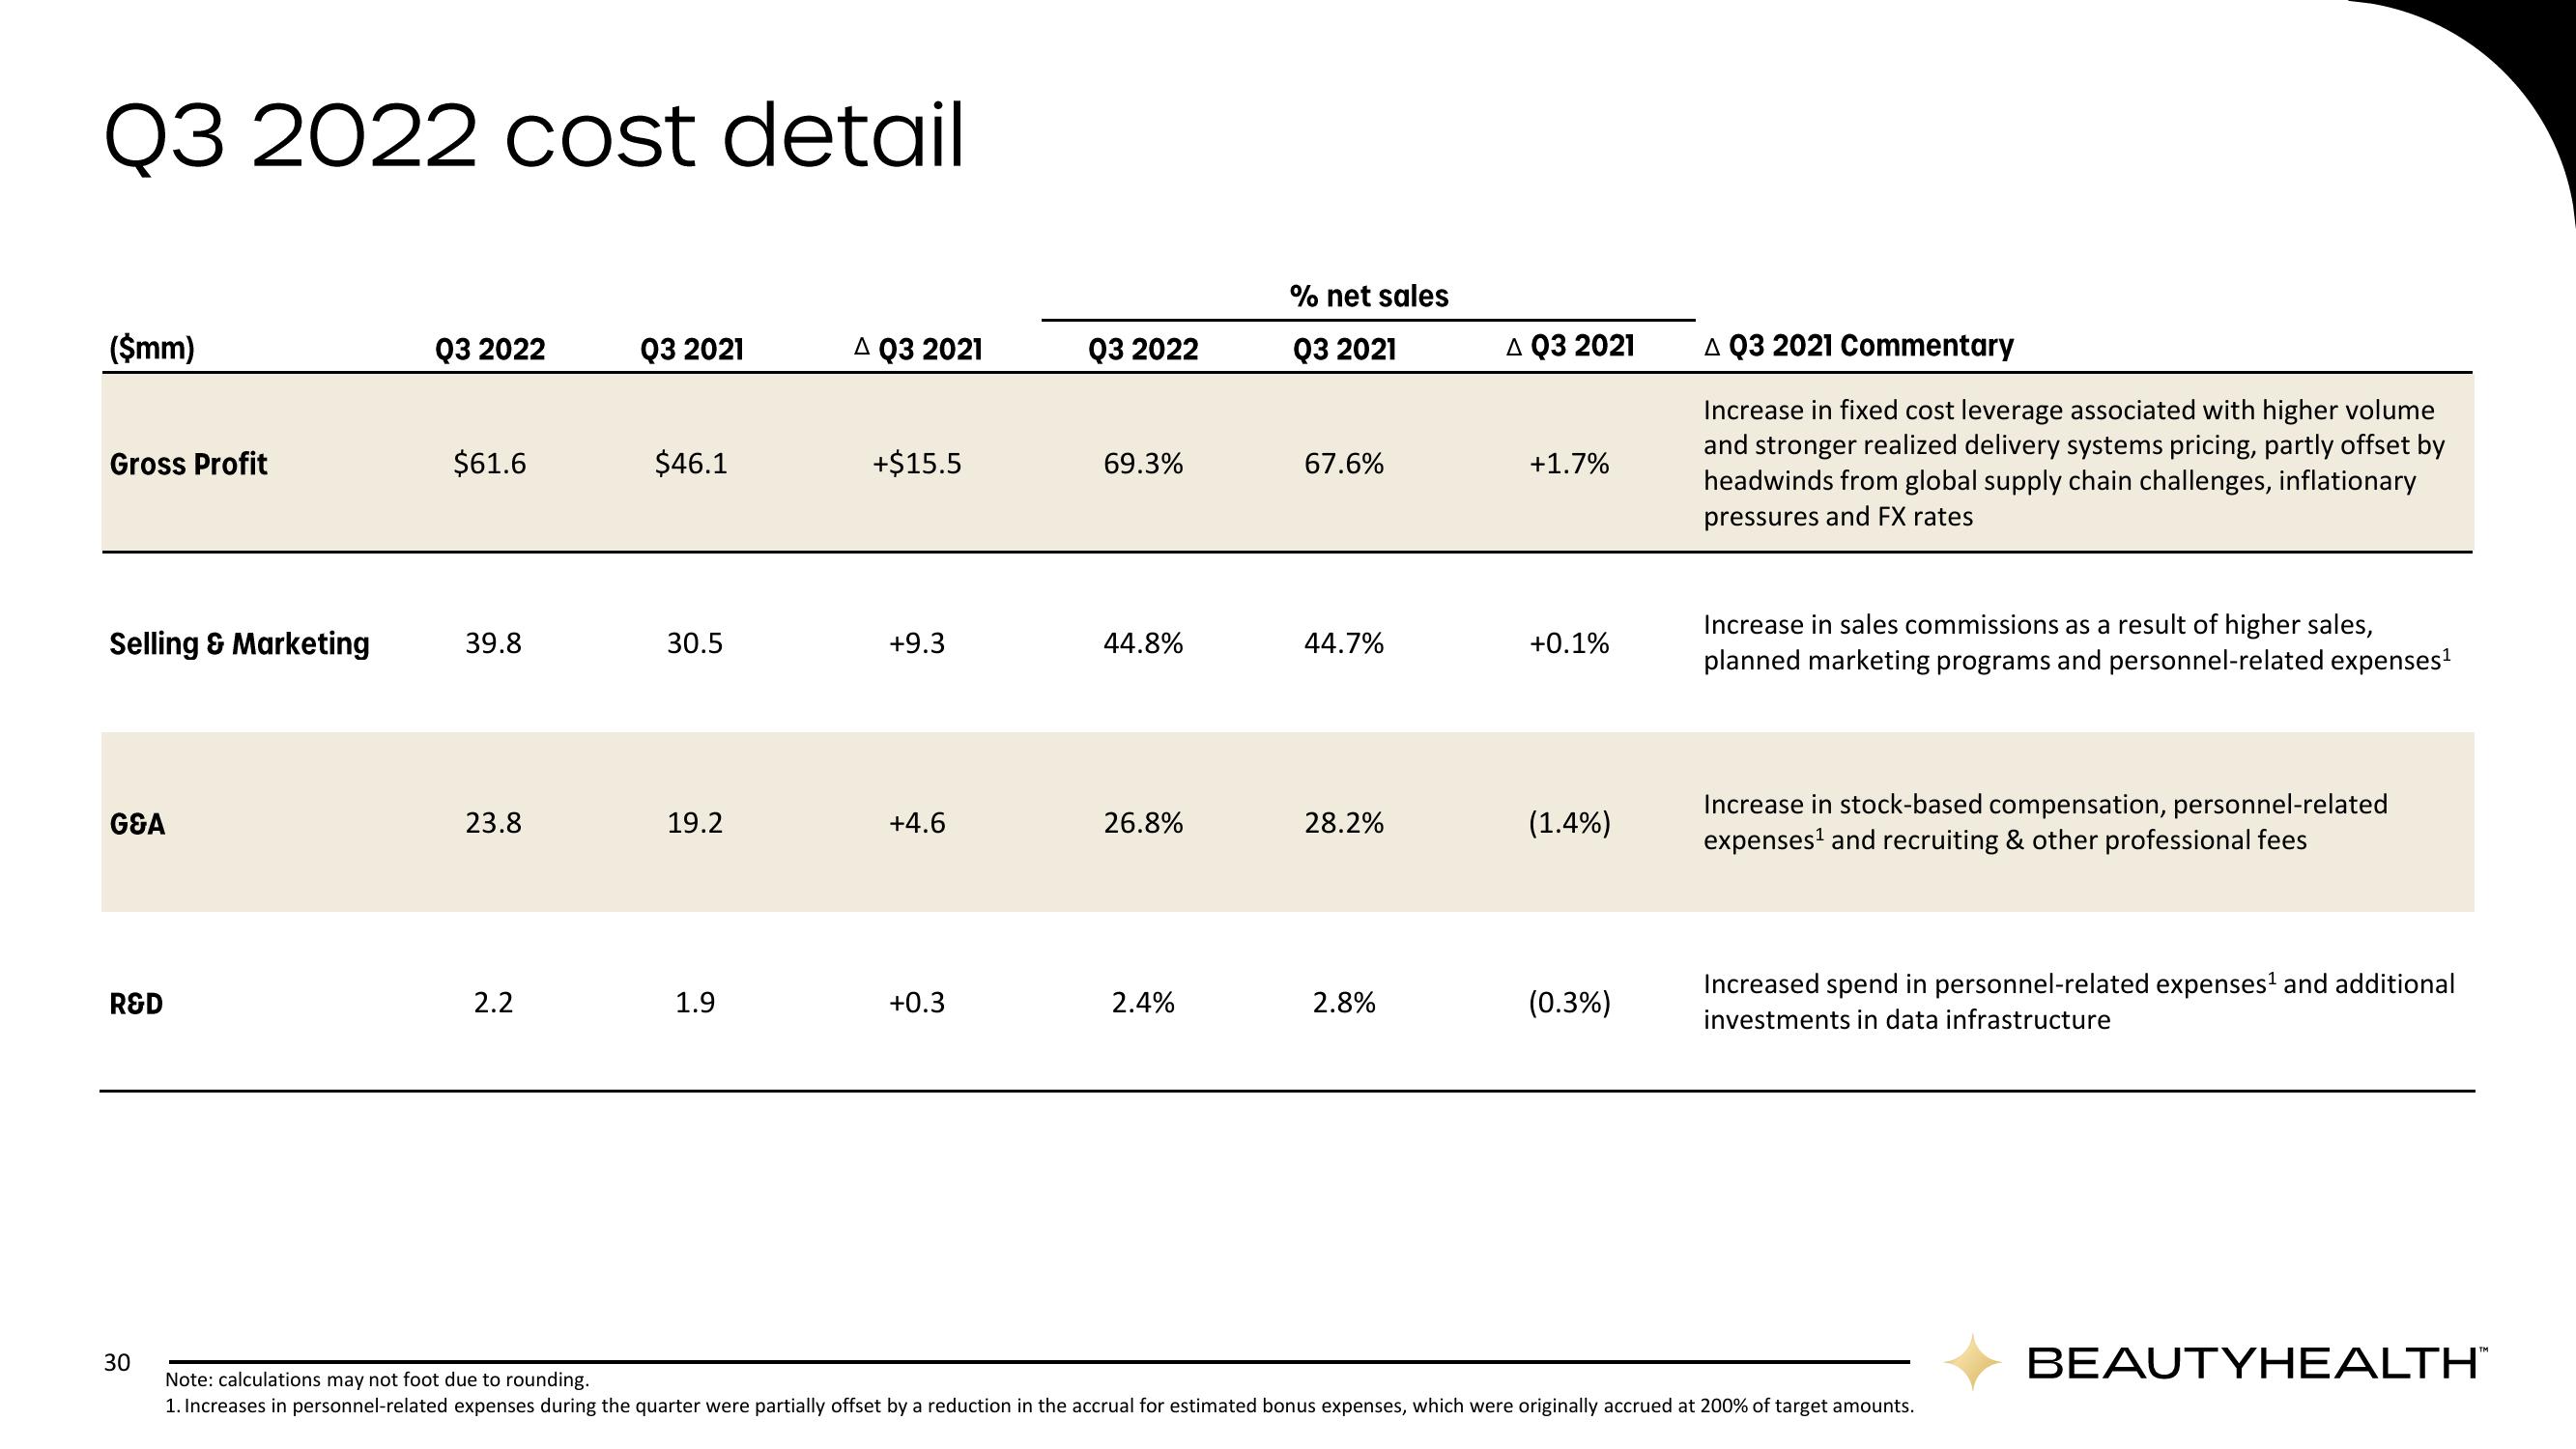
Q3 2022 cost detail
($mm)
Gross Profit
Selling & Marketing
G&A
R&D
30
Q3 2022 Q3 2021 A Q3 2021
$61.6
39.8
23.8
2.2
$46.1
30.5
19.2
1.9
+$15.5
+9.3
+4.6
+0.3
Q3 2022
69.3%
44.8%
26.8%
2.4%
% net sales
Q3 2021
67.6%
44.7%
28.2%
2.8%
Δ Q3 2021
+1.7%
+0.1%
(1.4%)
(0.3%)
A Q3 2021 Commentary
Increase in fixed cost leverage associated with higher volume
and stronger realized delivery systems pricing, partly offset by
headwinds from global supply chain challenges, inflationary
pressures and FX rates
Increase in sales commissions as a result of higher sales,
planned marketing programs and personnel-related expenses¹
Increase in stock-based compensation, personnel-related
expenses¹ and recruiting & other professional fees
Increased spend in personnel-related expenses¹ and additional
investments in data infrastructure
Note: calculations may not foot due to rounding.
1. Increases in personnel-related expenses during the quarter were partially offset by a reduction in the accrual for estimated bonus expenses, which were originally accrued at 200% of target amounts.
BEAUTYHEALTH™View entire presentation