Allego Results Presentation Deck
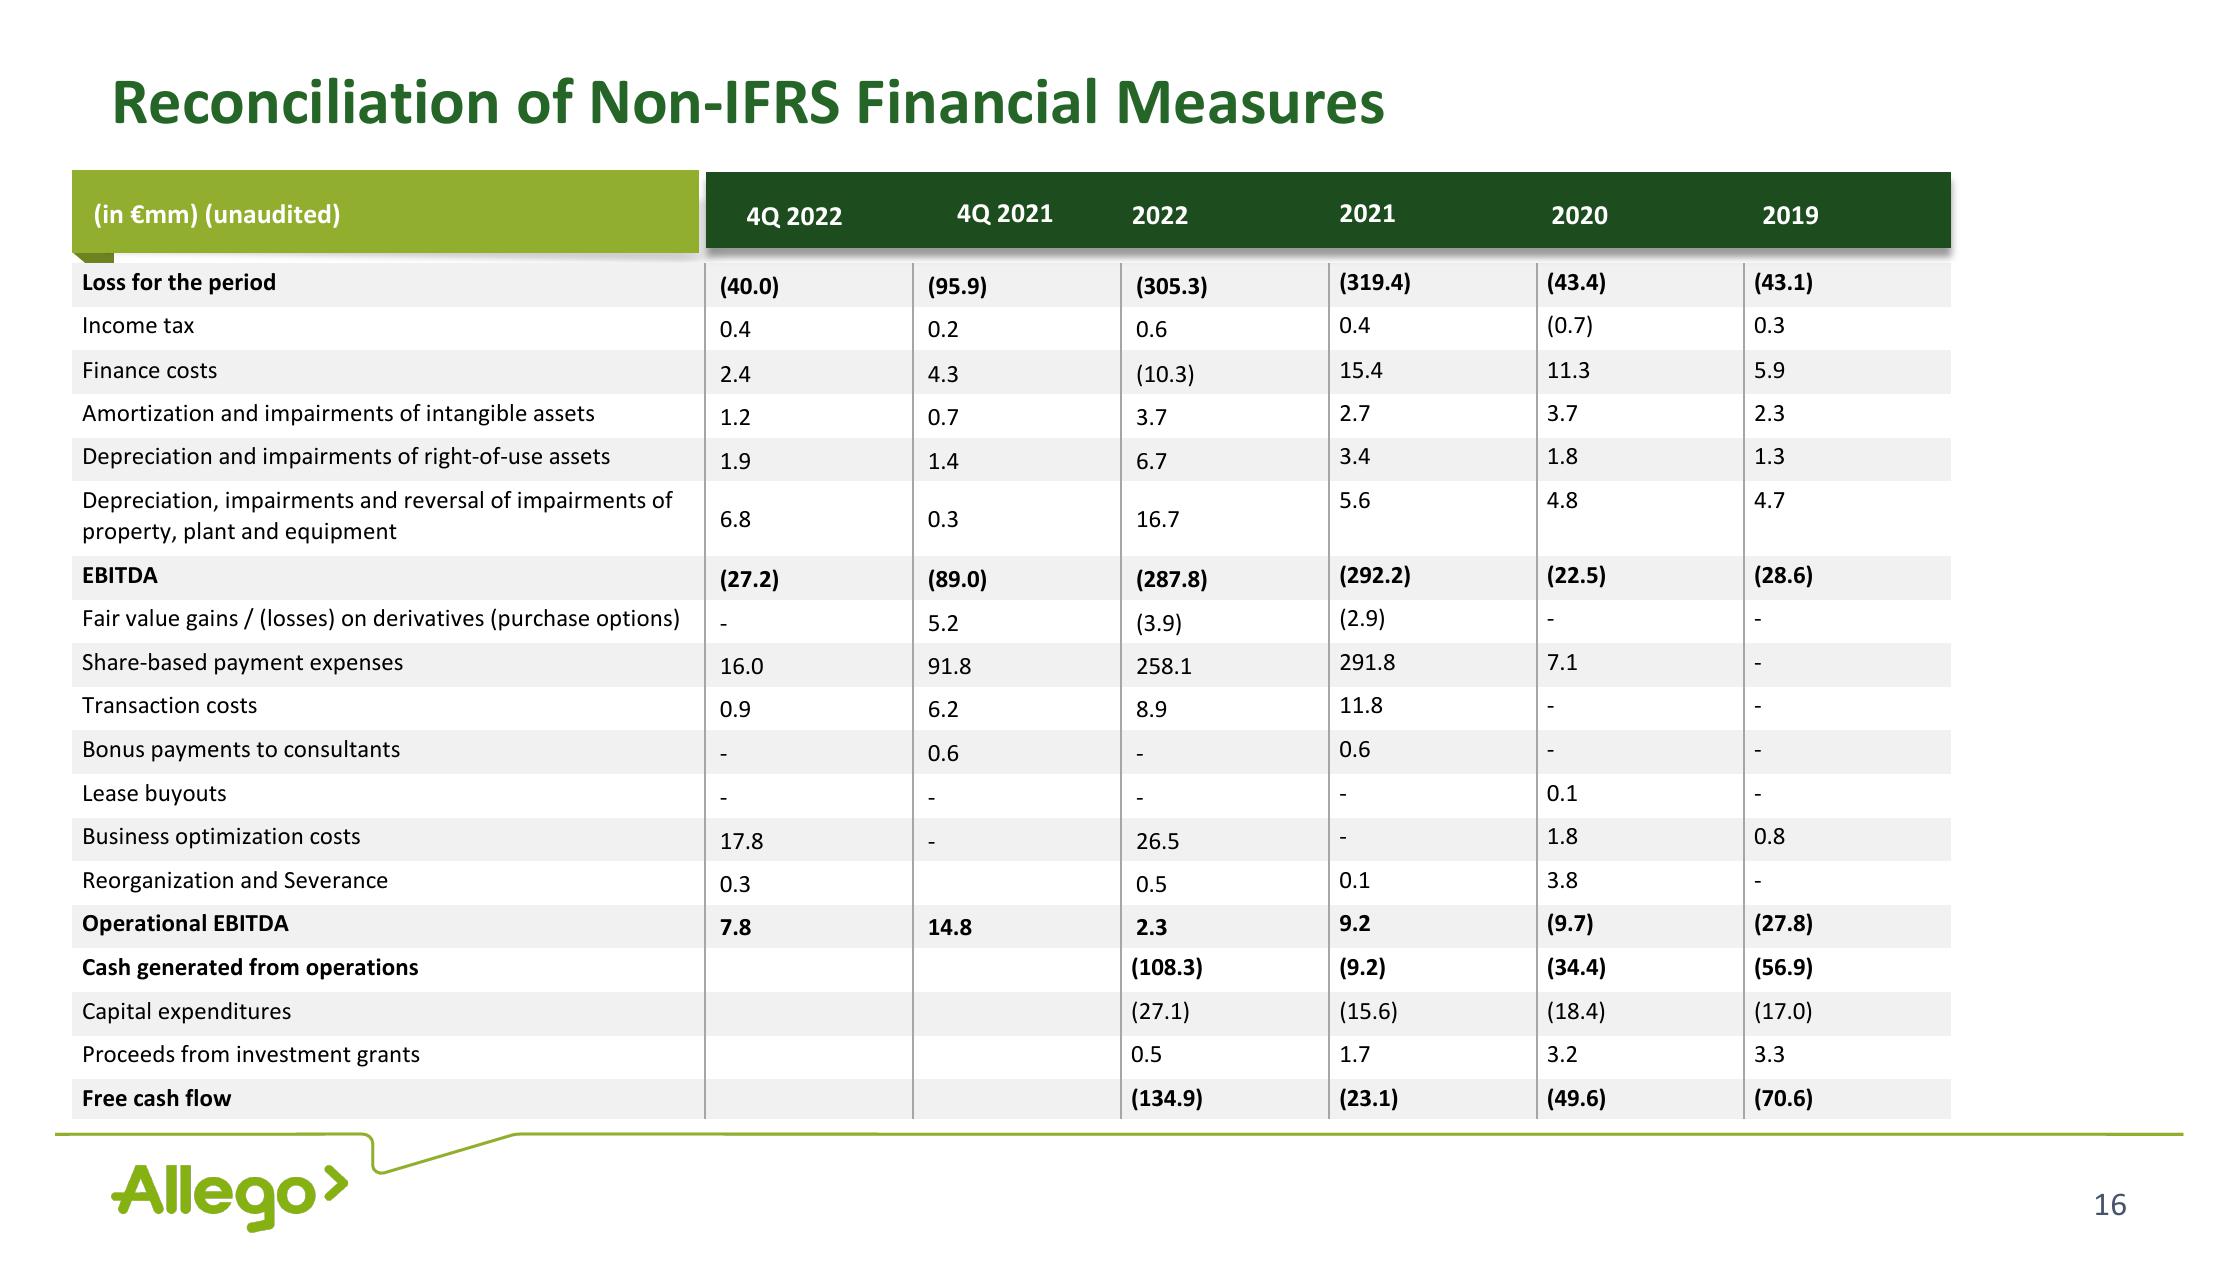
Reconciliation of Non-IFRS Financial Measures
(in €mm) (unaudited)
Loss for the period
Income tax
Finance costs
Amortization and impairments of intangible assets
Depreciation and impairments of right-of-use assets
Depreciation, impairments and reversal of impairments of
property, plant and equipment
EBITDA
Fair value gains / (losses) on derivatives (purchase options)
Share-based payment expenses
Transaction costs
Bonus payments to consultants
Lease buyouts
Business optimization costs
Reorganization and Severance
Operational EBITDA
Cash generated from operations
Capital expenditures
Proceeds from investment grants
Free cash flow
Allego>
4Q 2022
(40.0)
0.4
2.4
1.2
1.9
6.8
(27.2)
16.0
0.9
17.8
0.3
7.8
4Q 2021
(95.9)
0.2
4.3
0.7
1.4
0.3
(89.0)
5.2
91.8
6.2
0.6
14.8
2022
(305.3)
0.6
(10.3)
3.7
6.7
16.7
(287.8)
(3.9)
258.1
8.9
26.5
0.5
2.3
(108.3)
(27.1)
0.5
(134.9)
2021
(319.4)
0.4
15.4
2.7
3.4
5.6
(292.2)
(2.9)
291.8
11.8
0.6
0.1
9.2
(9.2)
(15.6)
1.7
(23.1)
2020
(43.4)
(0.7)
11.3
3.7
1.8
4.8
(22.5)
7.1
0.1
1.8
3.8
(9.7)
(34.4)
(18.4)
3.2
(49.6)
2019
(43.1)
0.3
.....
5.9
2.3
1.3
4.7
(28.6)
0.8
(27.8)
(56.9)
(17.0)
3.3
(70.6)
16View entire presentation