Wix Results Presentation Deck
Financial Performance
Please note all financial metrics include the impact of flok and DeviantArt, as
both acquisitions closed in Q1.
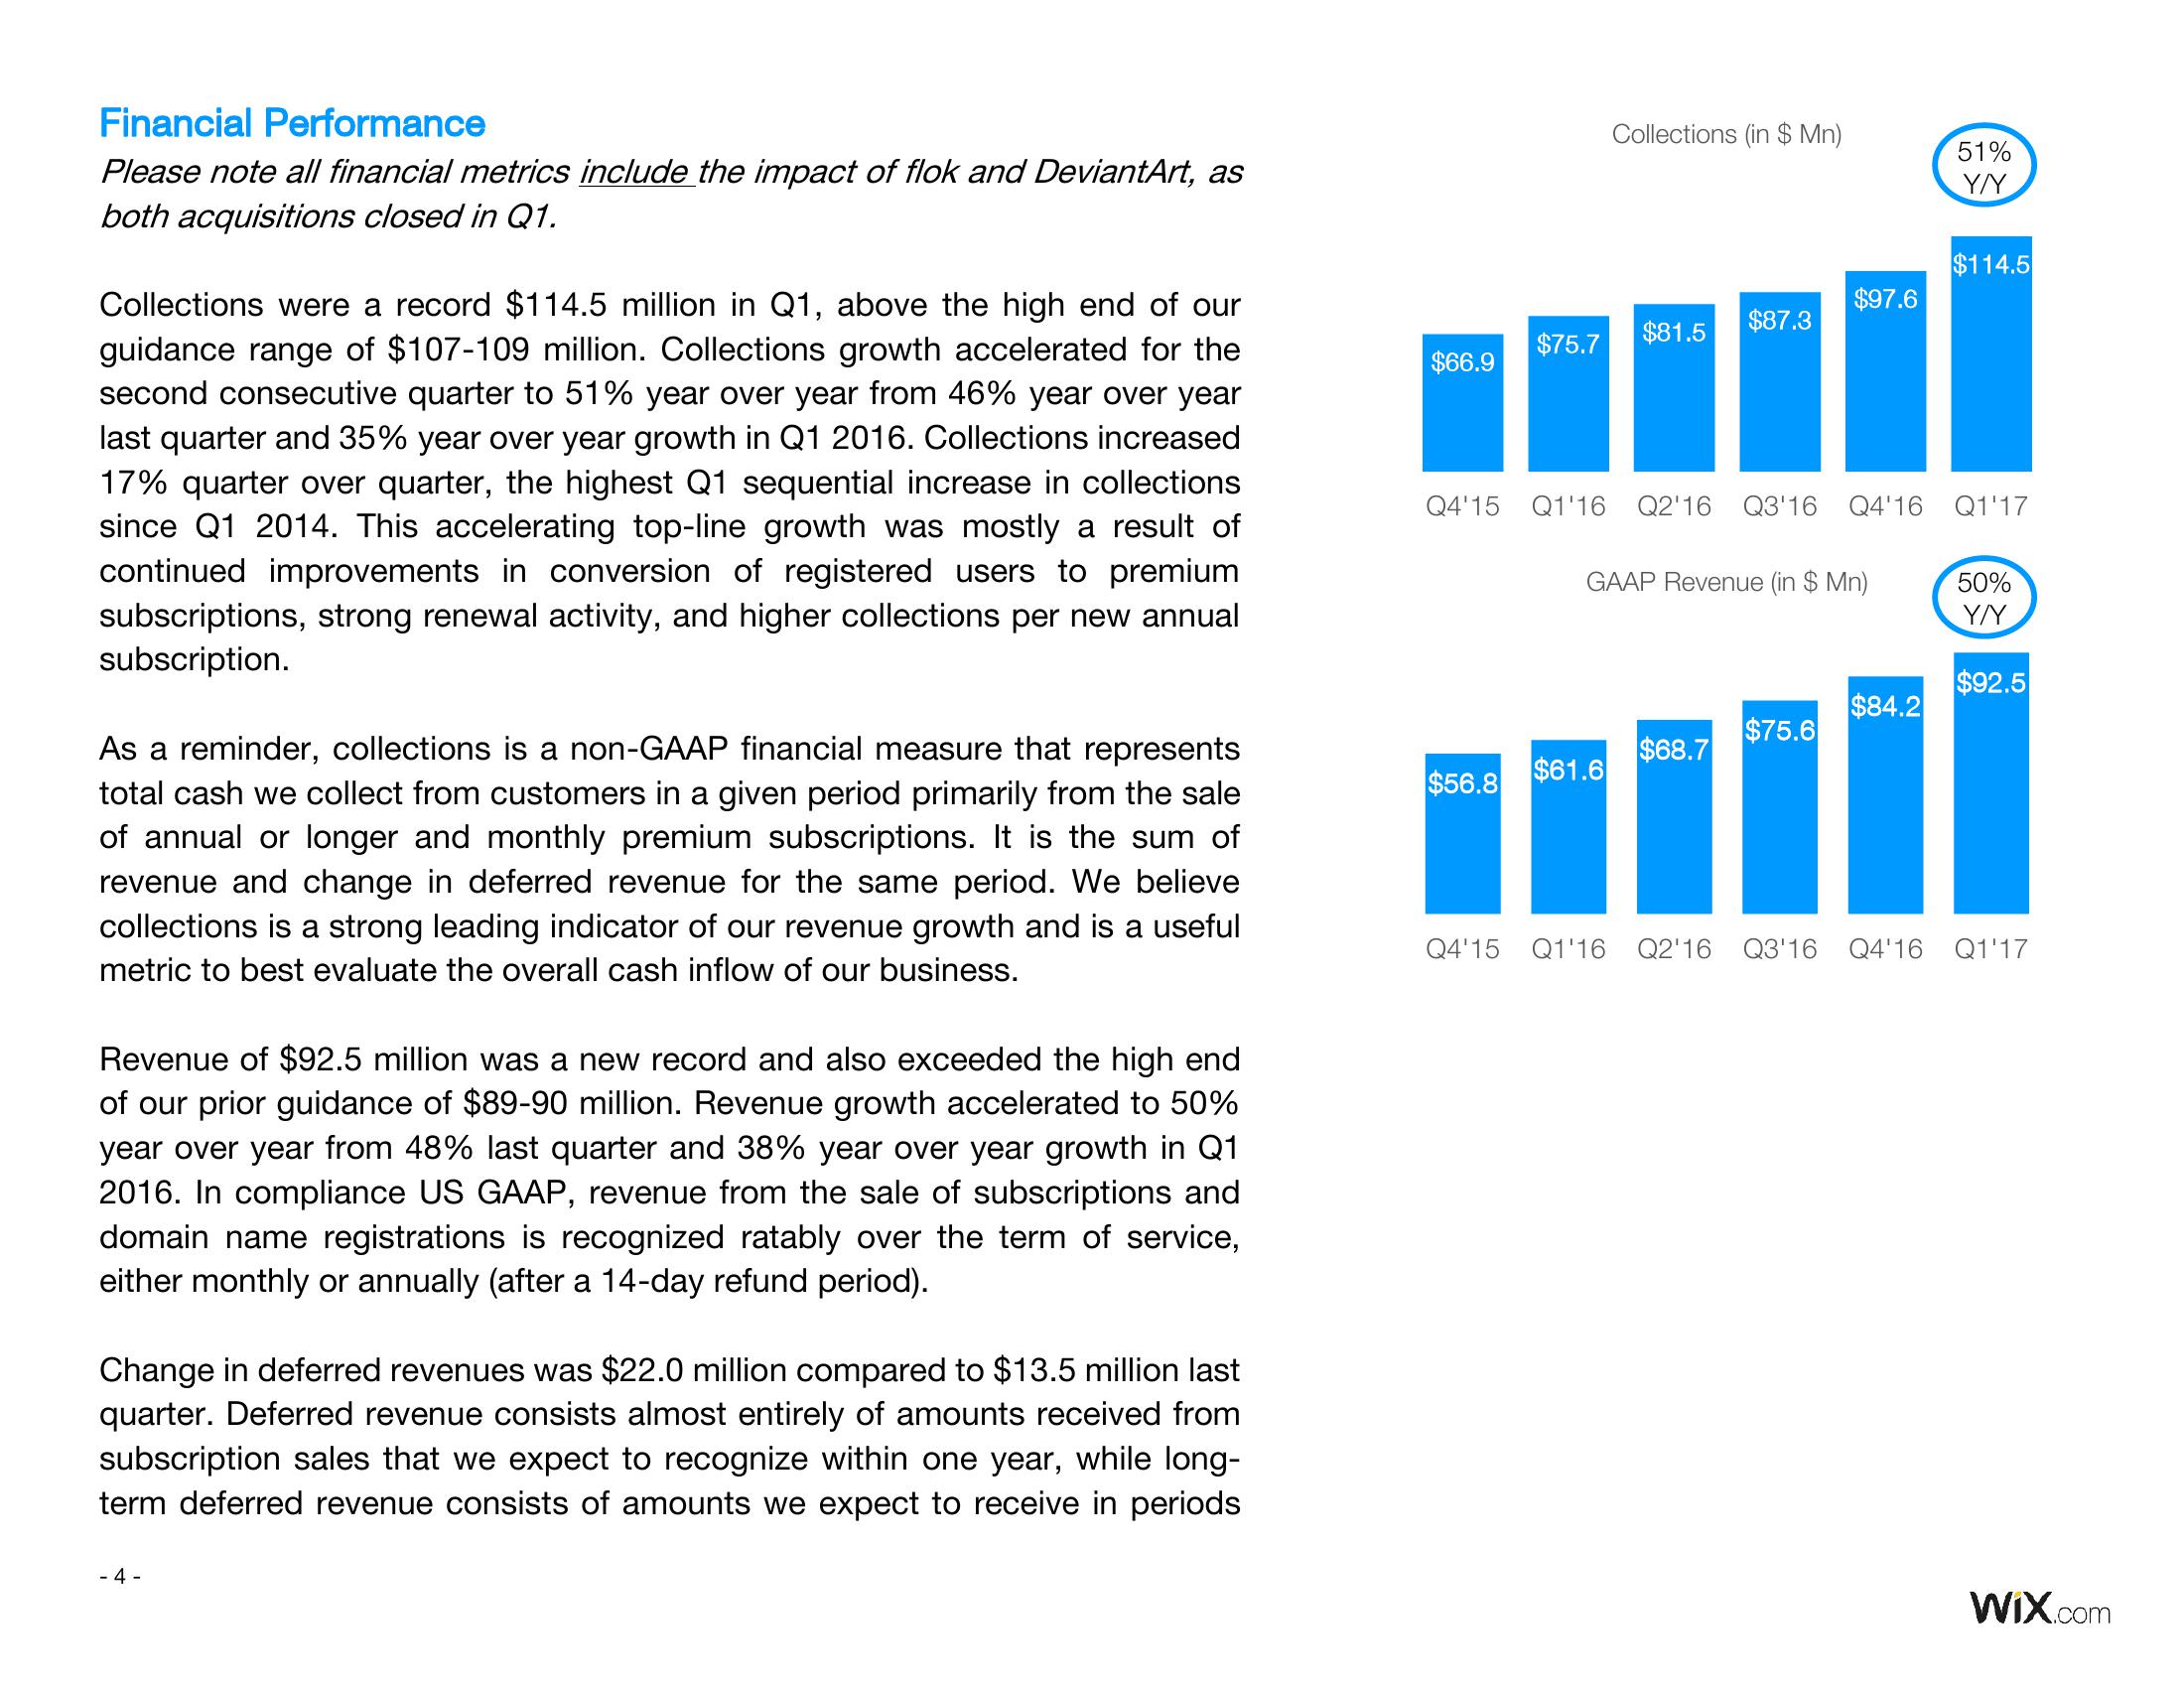
Collections were a record $114.5 million in Q1, above the high end of our
guidance range of $107-109 million. Collections growth accelerated for the
second consecutive quarter to 51% year over year from 46% year over year
last quarter and 35% year over year growth in Q1 2016. Collections increased
17% quarter over quarter, the highest Q1 sequential increase in collections
since Q1 2014. This accelerating top-line growth was mostly a result of
continued improvements in conversion of registered users to premium
subscriptions, strong renewal activity, and higher collections per new annual
subscription.
As a reminder, collections is a non-GAAP financial measure that represents
total cash we collect from customers in a given period primarily from the sale
of annual or longer and monthly premium subscriptions. It is the sum of
revenue and change in deferred revenue for the same period. We believe
collections is a strong leading indicator of our revenue growth and is a useful
metric to best evaluate the overall cash inflow of our business.
Revenue of $92.5 million was a new record and also exceeded the high end
of our prior guidance of $89-90 million. Revenue growth accelerated to 50%
year over year from 48% last quarter and 38% year over year growth in Q1
2016. In compliance US GAAP, revenue from the sale of subscriptions and
domain name registrations is recognized ratably over the term of service,
either monthly or annually (after a 14-day refund period).
Change in deferred revenues was $22.0 million compared to $13.5 million last
quarter. Deferred revenue consists almost entirely of amounts received from
subscription sales that we expect to recognize within one year, while long-
term deferred revenue consists of amounts we expect to receive in periods
- 4-
$66.9
$75.7
$56.8
Collections (in $ Mn)
$81.5
$61.6
Q4'15 Q1'16 Q2'16 Q3'16 Q4'16
$87.3
GAAP Revenue (in $ Mn)
$68.7
$97.6
$75.6
$84.2
51%
Y/Y
$114.5
Q1'17
50%
Y/Y
$92.5
Q4'15 Q1'16 Q2'16 Q3'16 Q4'16 Q1'17
Wix.comView entire presentation