Toyota Investor Presentation Deck
TMC Financial Highlights
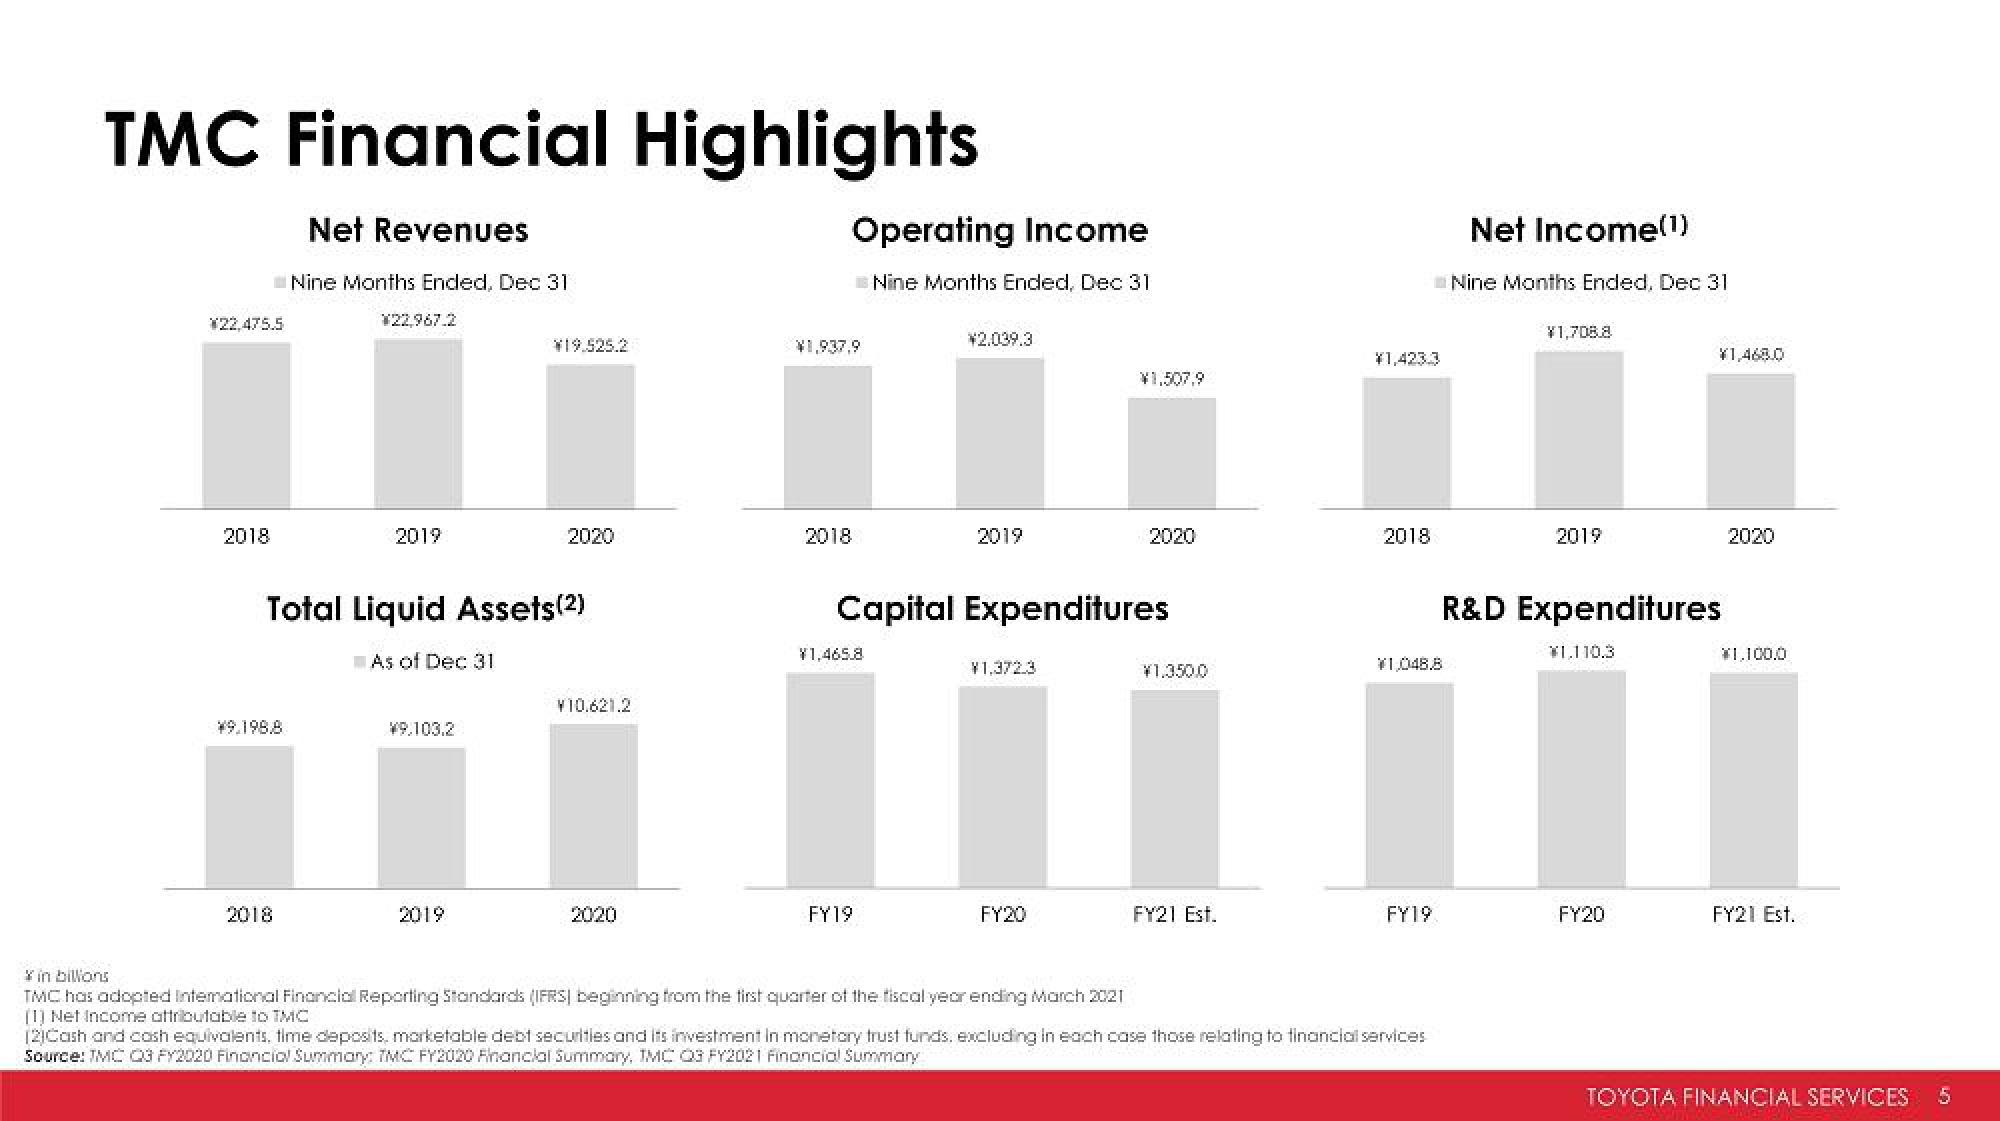
Net Revenues
¥22,475.5
2018
Nine Months Ended, Dec 31
¥9.198.8
¥22,967.2
2019
Total Liquid Assets(2)
As of Dec 31
¥9,103.2
¥19.525.2
2019
2020
¥10.621.2
2020
Operating Income
Nine Months Ended, Dec 31
¥1,937,9
2018
¥1,465.8
¥2.039.3
FY19
2019
Capital Expenditures
¥1.372.3
¥1,507,9
FY20
2020
¥1.350.0
FY21 Est.
¥1,423.3
2018
¥1,048.8
FY19
in billions
TMC has adopted International Financial Reporting Standards (IFRS) beginning from the first quarter of the fiscal year ending March 2021
[1] Net Income attributable to TMC
(2)Cash and cash equivalents, time deposits, marketable debt securities and its investment in monetary trust funds, excluding in each case those relating to financial services
Source: TMC Q3 FY2020 Financial Summary: TMC FY2020 Financial Summary, TMC Q3 FY2021 Financial Summary
Net Income(1)
Nine Months Ended, Dec 31
¥1,708.8
2019
R&D Expenditures
1.110.3
¥1,468.0
FY20
2020
¥1.100.0
FY21 Est.
TOYOTA FINANCIAL SERVICES 5View entire presentation