BlackRock Results Presentation Deck
Operating Income
GAAP
Non-GAAP expense adjustments
As Adjusted
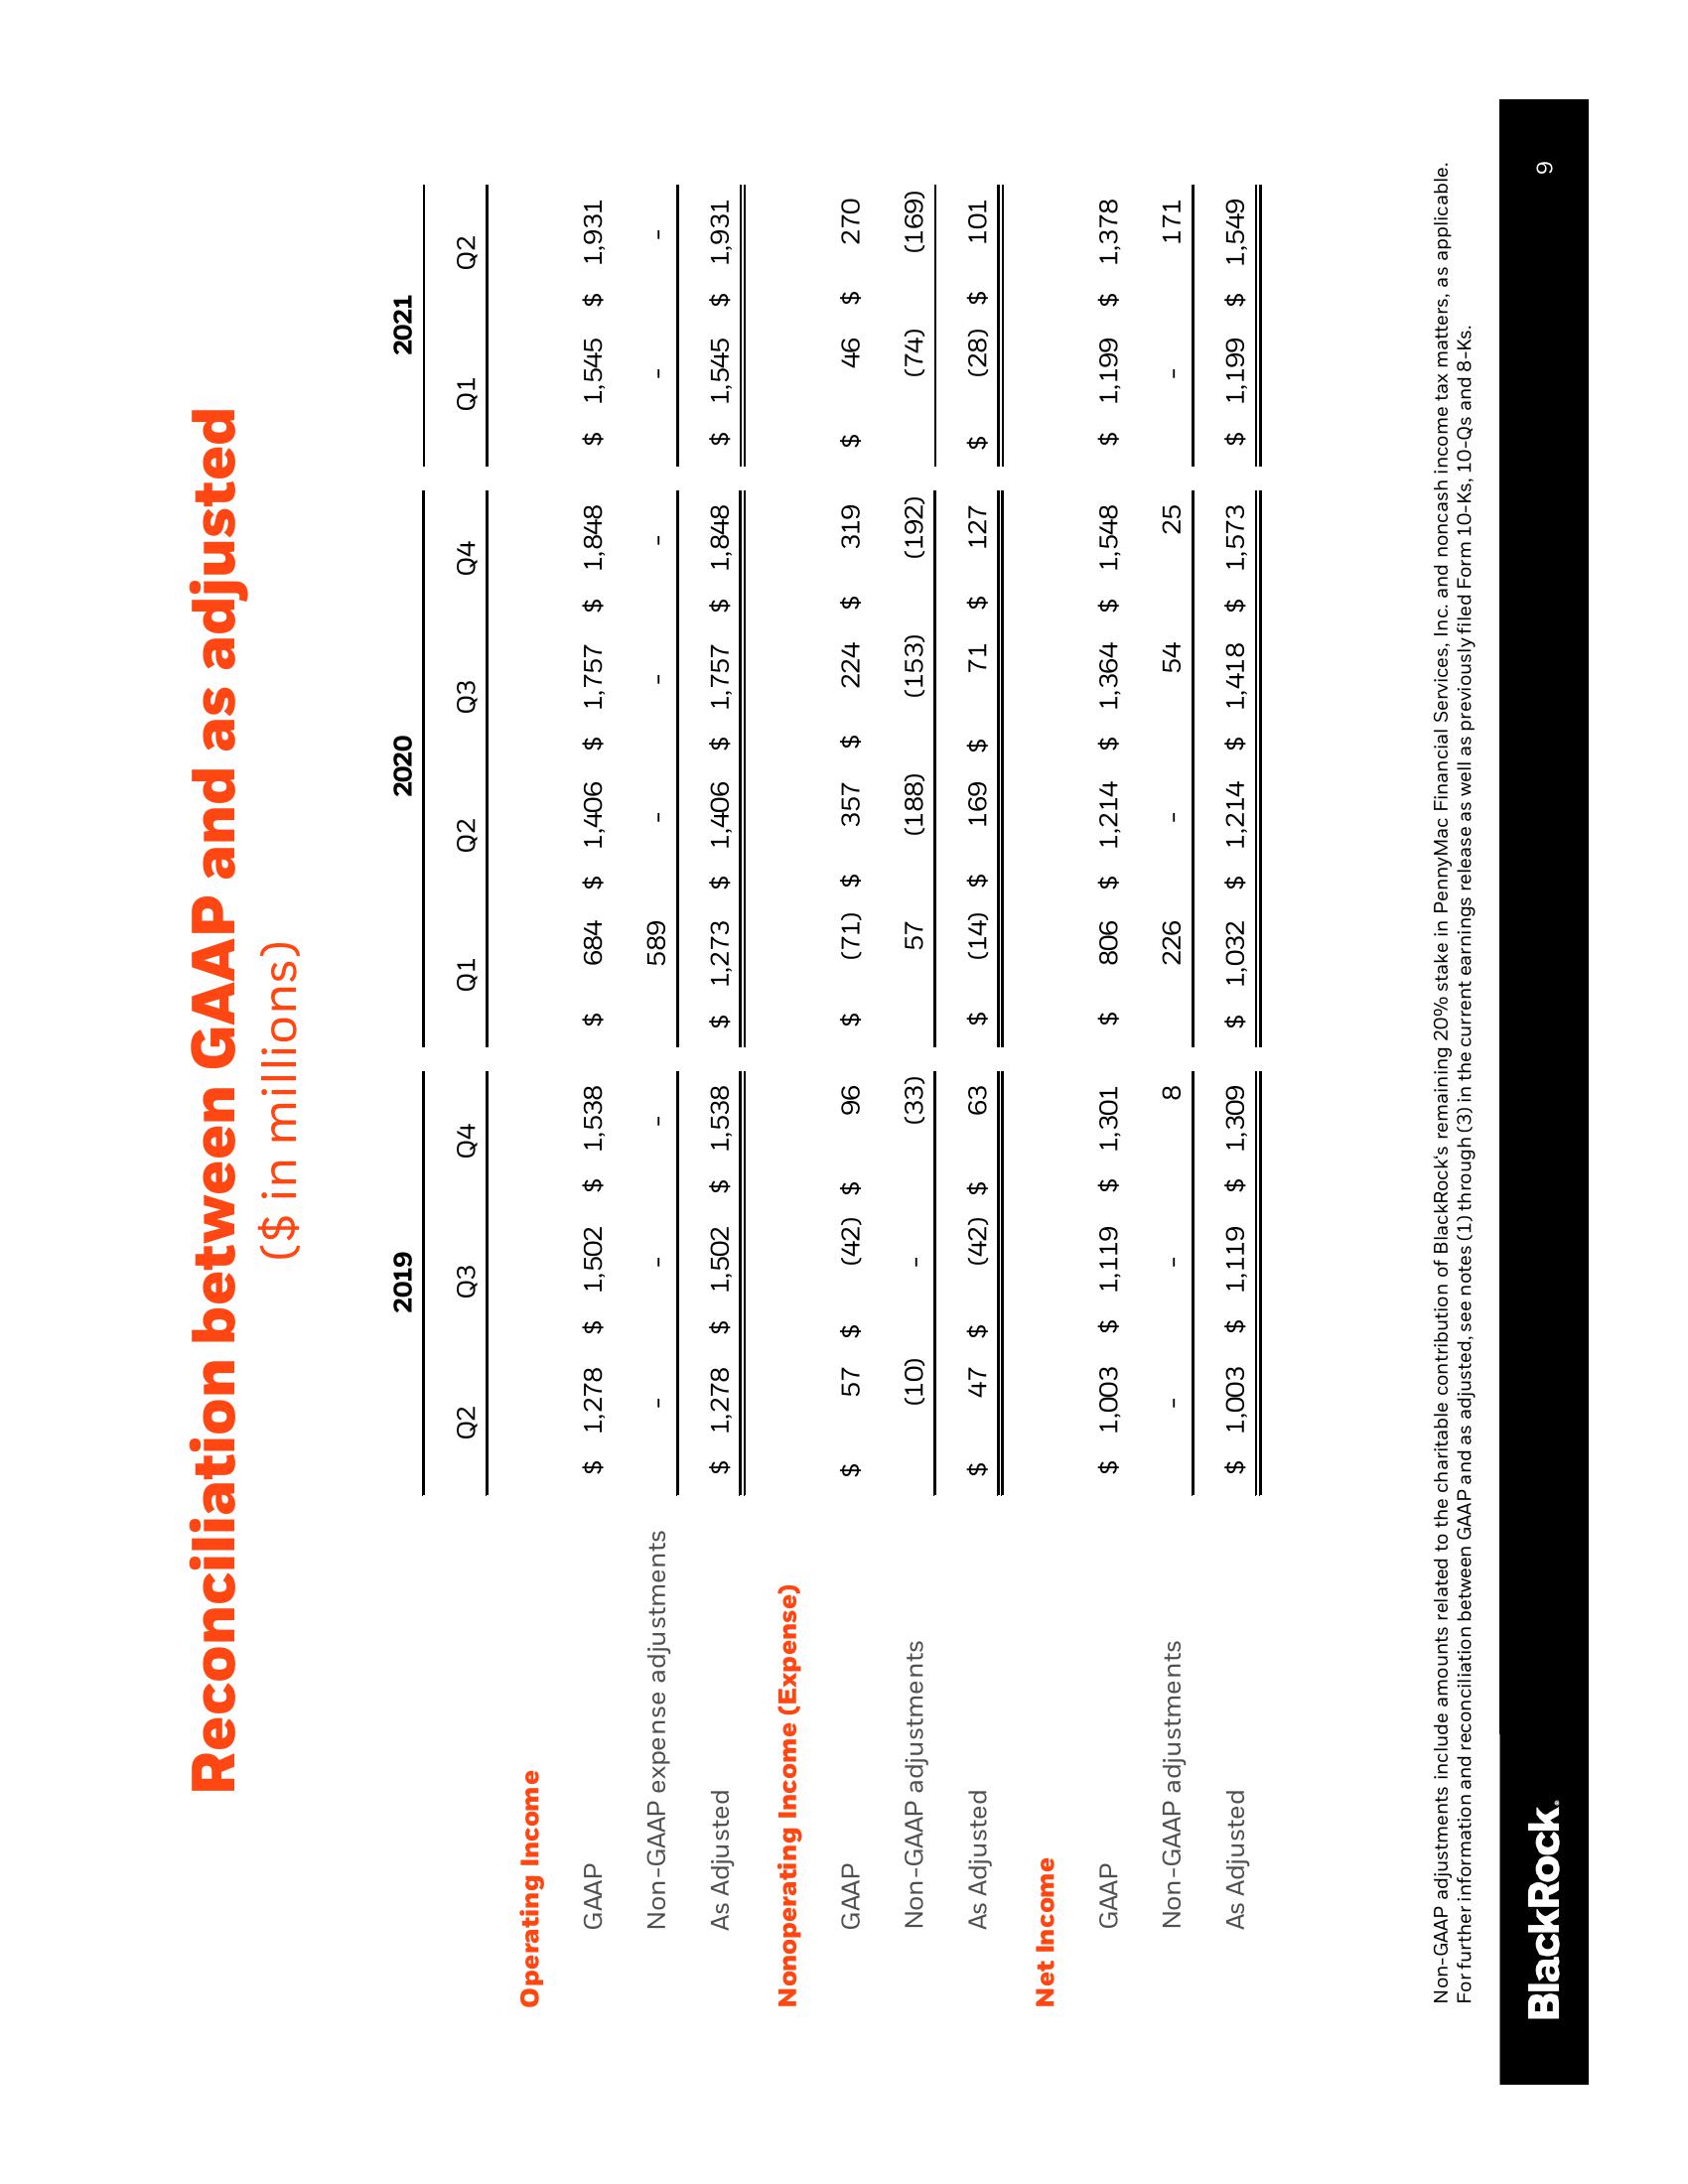
Reconciliation between GAAP and as adjusted
($ in millions)
Nonoperating Income (Expense)
GAAP
Non-GAAP adjustments
As Adjusted
Net Income
GAAP
Non-GAAP adjustments
As Adjusted
Q2
$
$
$ 1,278 $ 1,502 $ 1,538
$ 1,278 $ 1,502
57 $
2019
(10)
Q3
47 $
Q4
$ 1,538
(42) $
(42) $
(33)
63
$ 1,003 $ 1,119 $ 1,301
8
$
$ 1,003 $ 1,119 $ 1,309
96 $ (71) $
Q1
$
684
$
589
57
Q2
$ 1,273 $ 1,406 $ 1,757 $ 1,848
2020
226
$ 1,406 $ 1,757 $ 1,848
Q3
(188)
(14) $ 169 $
357 $ 224 $ 319
Q4
(153)
(192)
71 $ 127
806 $ 1,214 $ 1,364 $ 1,548
54
25
$ 1,032 $ 1,214 $ 1,418 $ 1,573
Q1
2021
$ 1,545 $ 1,931
$
Q2
$ 1,545 $ 1,931
$ 46 $ 270
(74)
(169)
(28) $ 101
$ 1,199 $ 1,378
171
$ 1,199 $ 1,549
Non-GAAP adjustments include amounts related to the charitable contribution of BlackRock's remaining 20% stake in PennyMac Financial Services, Inc. and noncash income tax matters, as applicable.
For further information and reconciliation between GAAP and as adjusted, see notes (1) through (3) in the current earnings release as well as previously filed Form 10-Ks, 10-Qs and 8-Ks.
BlackRock.
9View entire presentation