Owens&Minor Results Presentation Deck
3
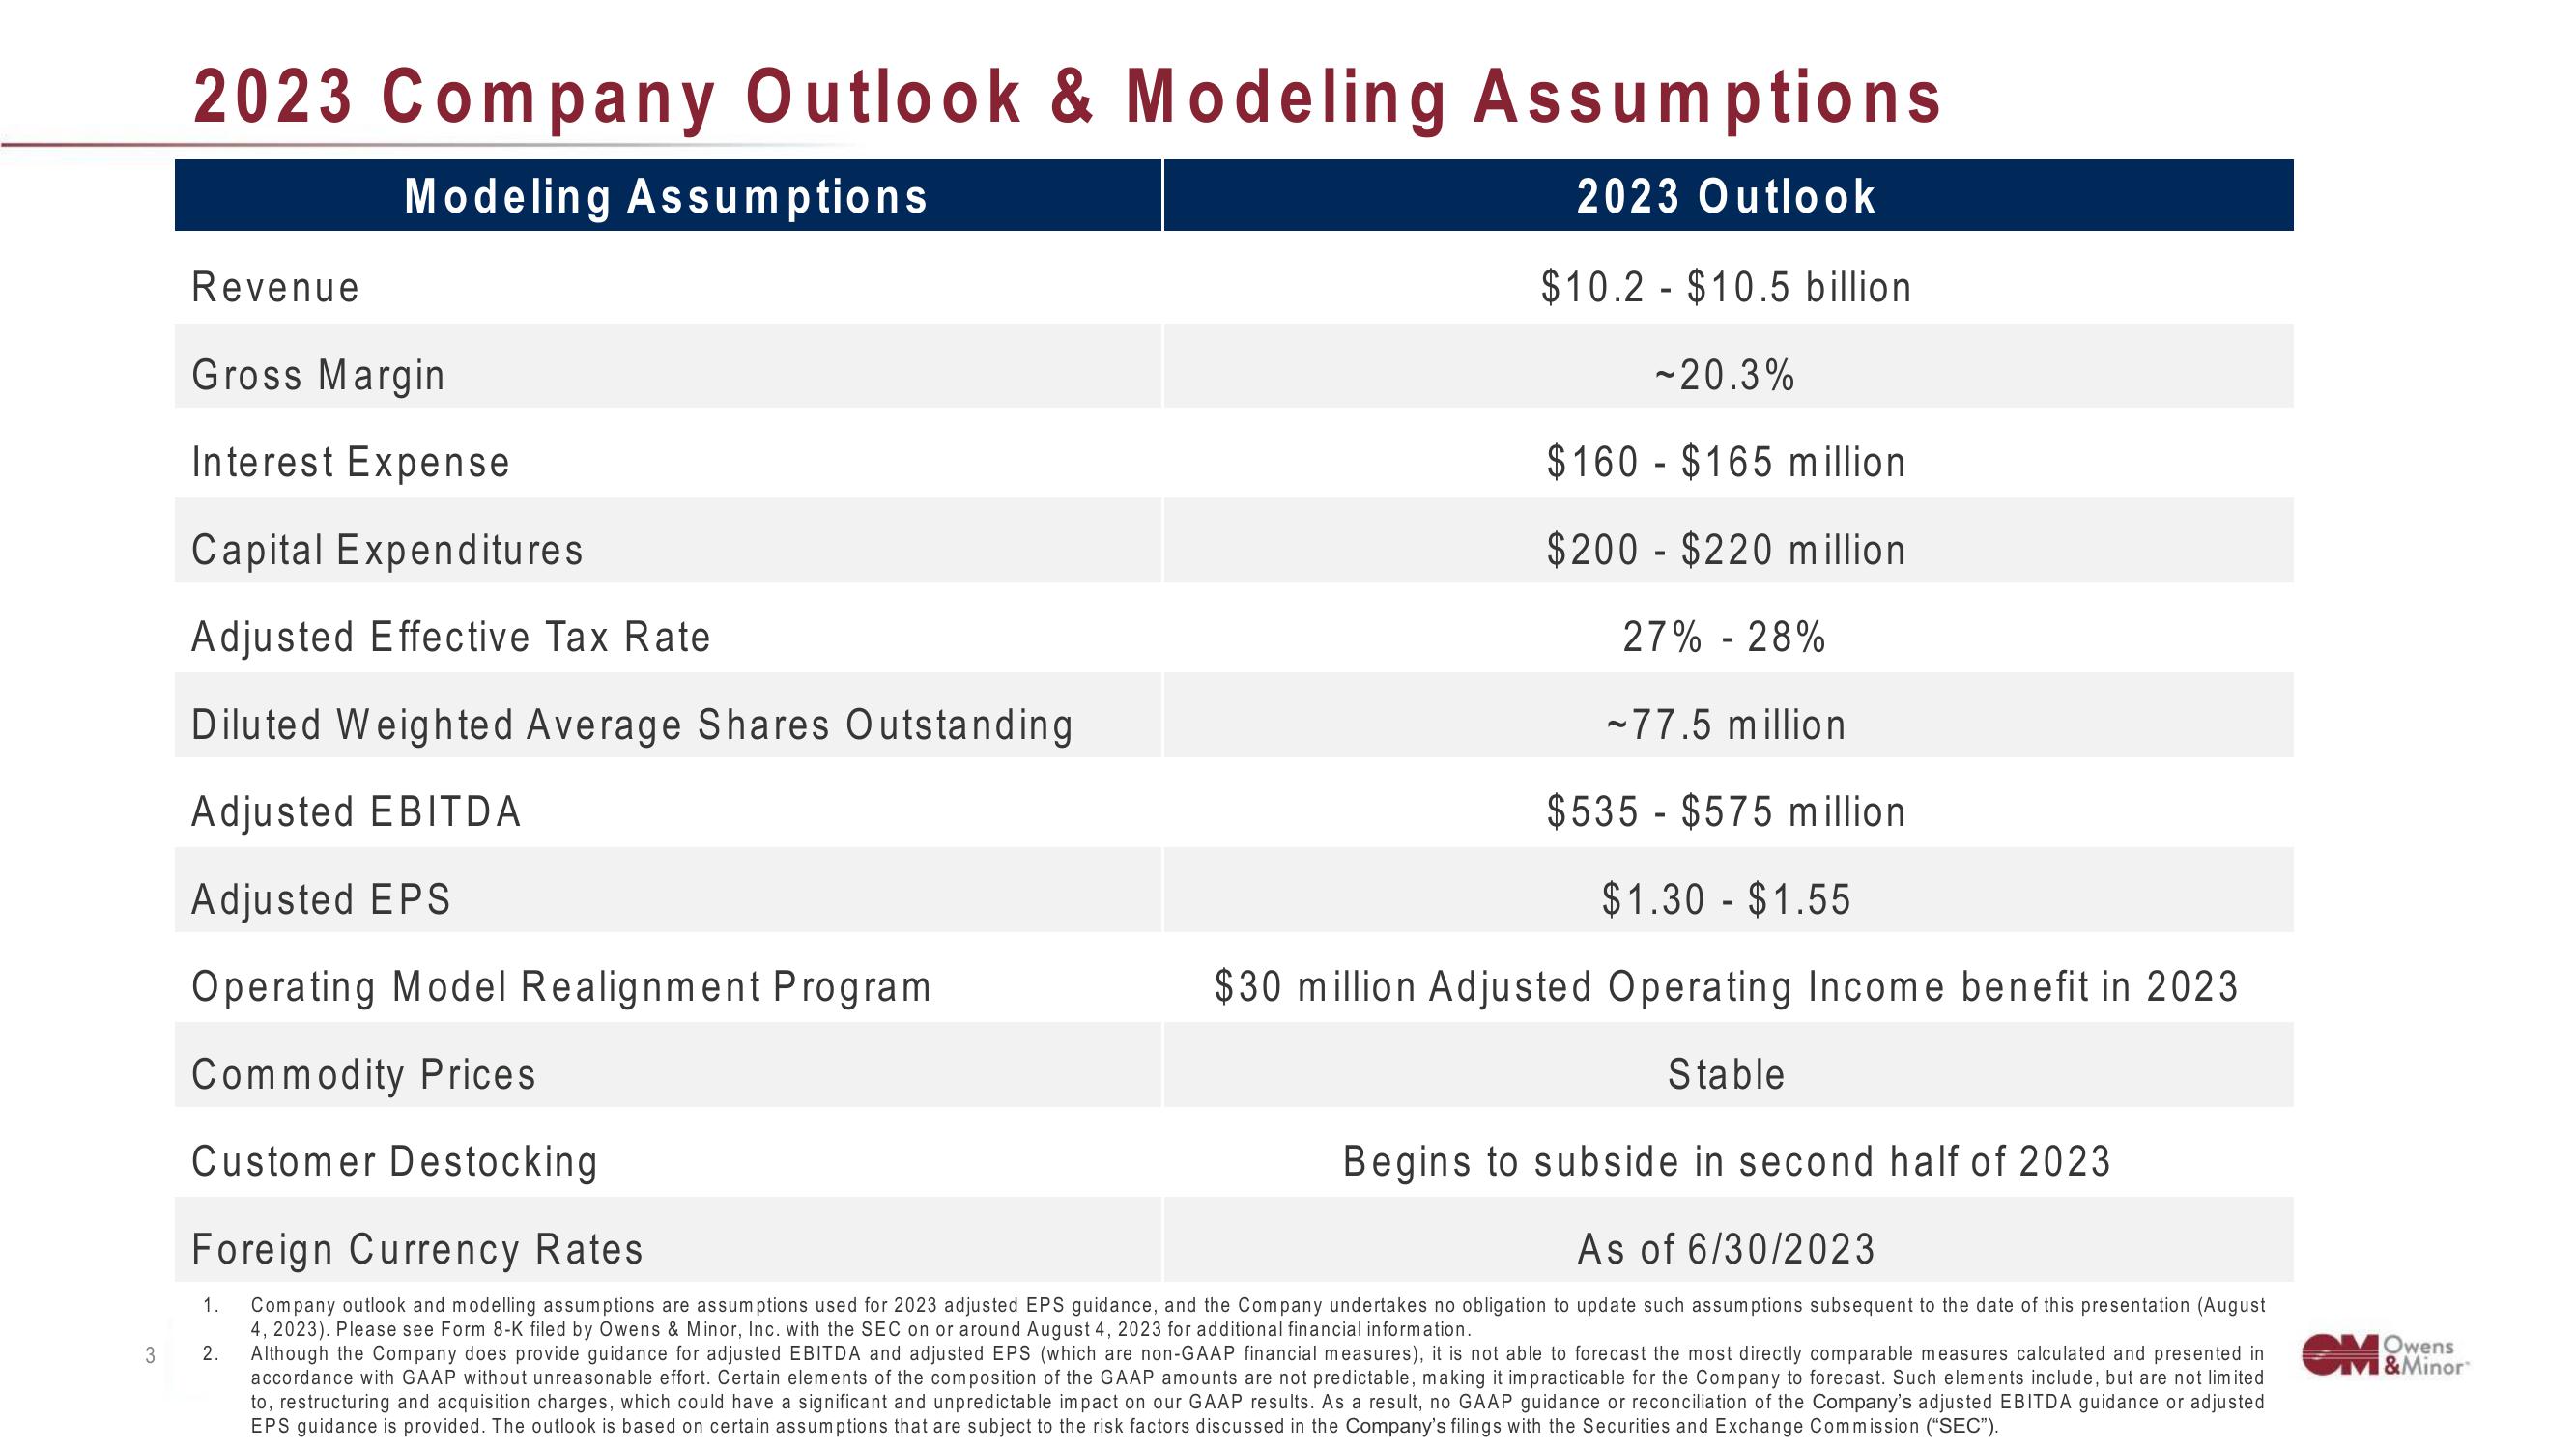
2023 Company Outlook & Modeling Assumptions
Modeling Assumptions
2023 Outlook
$10.2 $10.5 billion.
~20.3%
Revenue
Gross Margin
Interest Expense
Capital Expenditures
Adjusted Effective Tax Rate
Diluted Weighted Average Shares Outstanding
Adjusted EBITDA
Adjusted EPS
Operating Model Realignment Program
Commodity Prices
Customer Destocking
-
1.
$160
$165 million.
$200 $220 million
-
27% -28%
~77.5 million
$535 $575 million.
$1.30 - $1.55
$30 million Adjusted Operating Income benefit in 2023
Stable
Begins to subside in second half of 2023.
Foreign Currency Rates
As of 6/30/2023
Company outlook and modelling assumptions are assumptions used for 2023 adjusted EPS guidance, and the Company undertakes no obligation to update such assumptions subsequent to the date of this presentation (August
4, 2023). Please see Form 8-K filed by Owens & Minor, Inc. with the SEC on or around August 4, 2023 for additional financial information.
2. Although the Company does provide guidance for adjusted EBITDA and adjusted EPS (which are non-GAAP financial measures), it is not able to forecast the most directly comparable measures calculated and presented in
accordance with GAAP without unreasonable effort. Certain elements of the composition of the GAAP amounts are not predictable, making it impracticable for the Company to forecast. Such elements include, but are not limited
to, restructuring and acquisition charges, which could have a significant and unpredictable impact on our GAAP results. As a result, no GAAP guidance or reconciliation of the Company's adjusted EBITDA guidance or adjusted
EPS guidance is provided. The outlook is based on certain assumptions that are subject to the risk factors discussed in the Company's filings with the Securities and Exchange Commission ("SEC").
Owens
M&MinorView entire presentation