Docebo Investor Presentation Deck
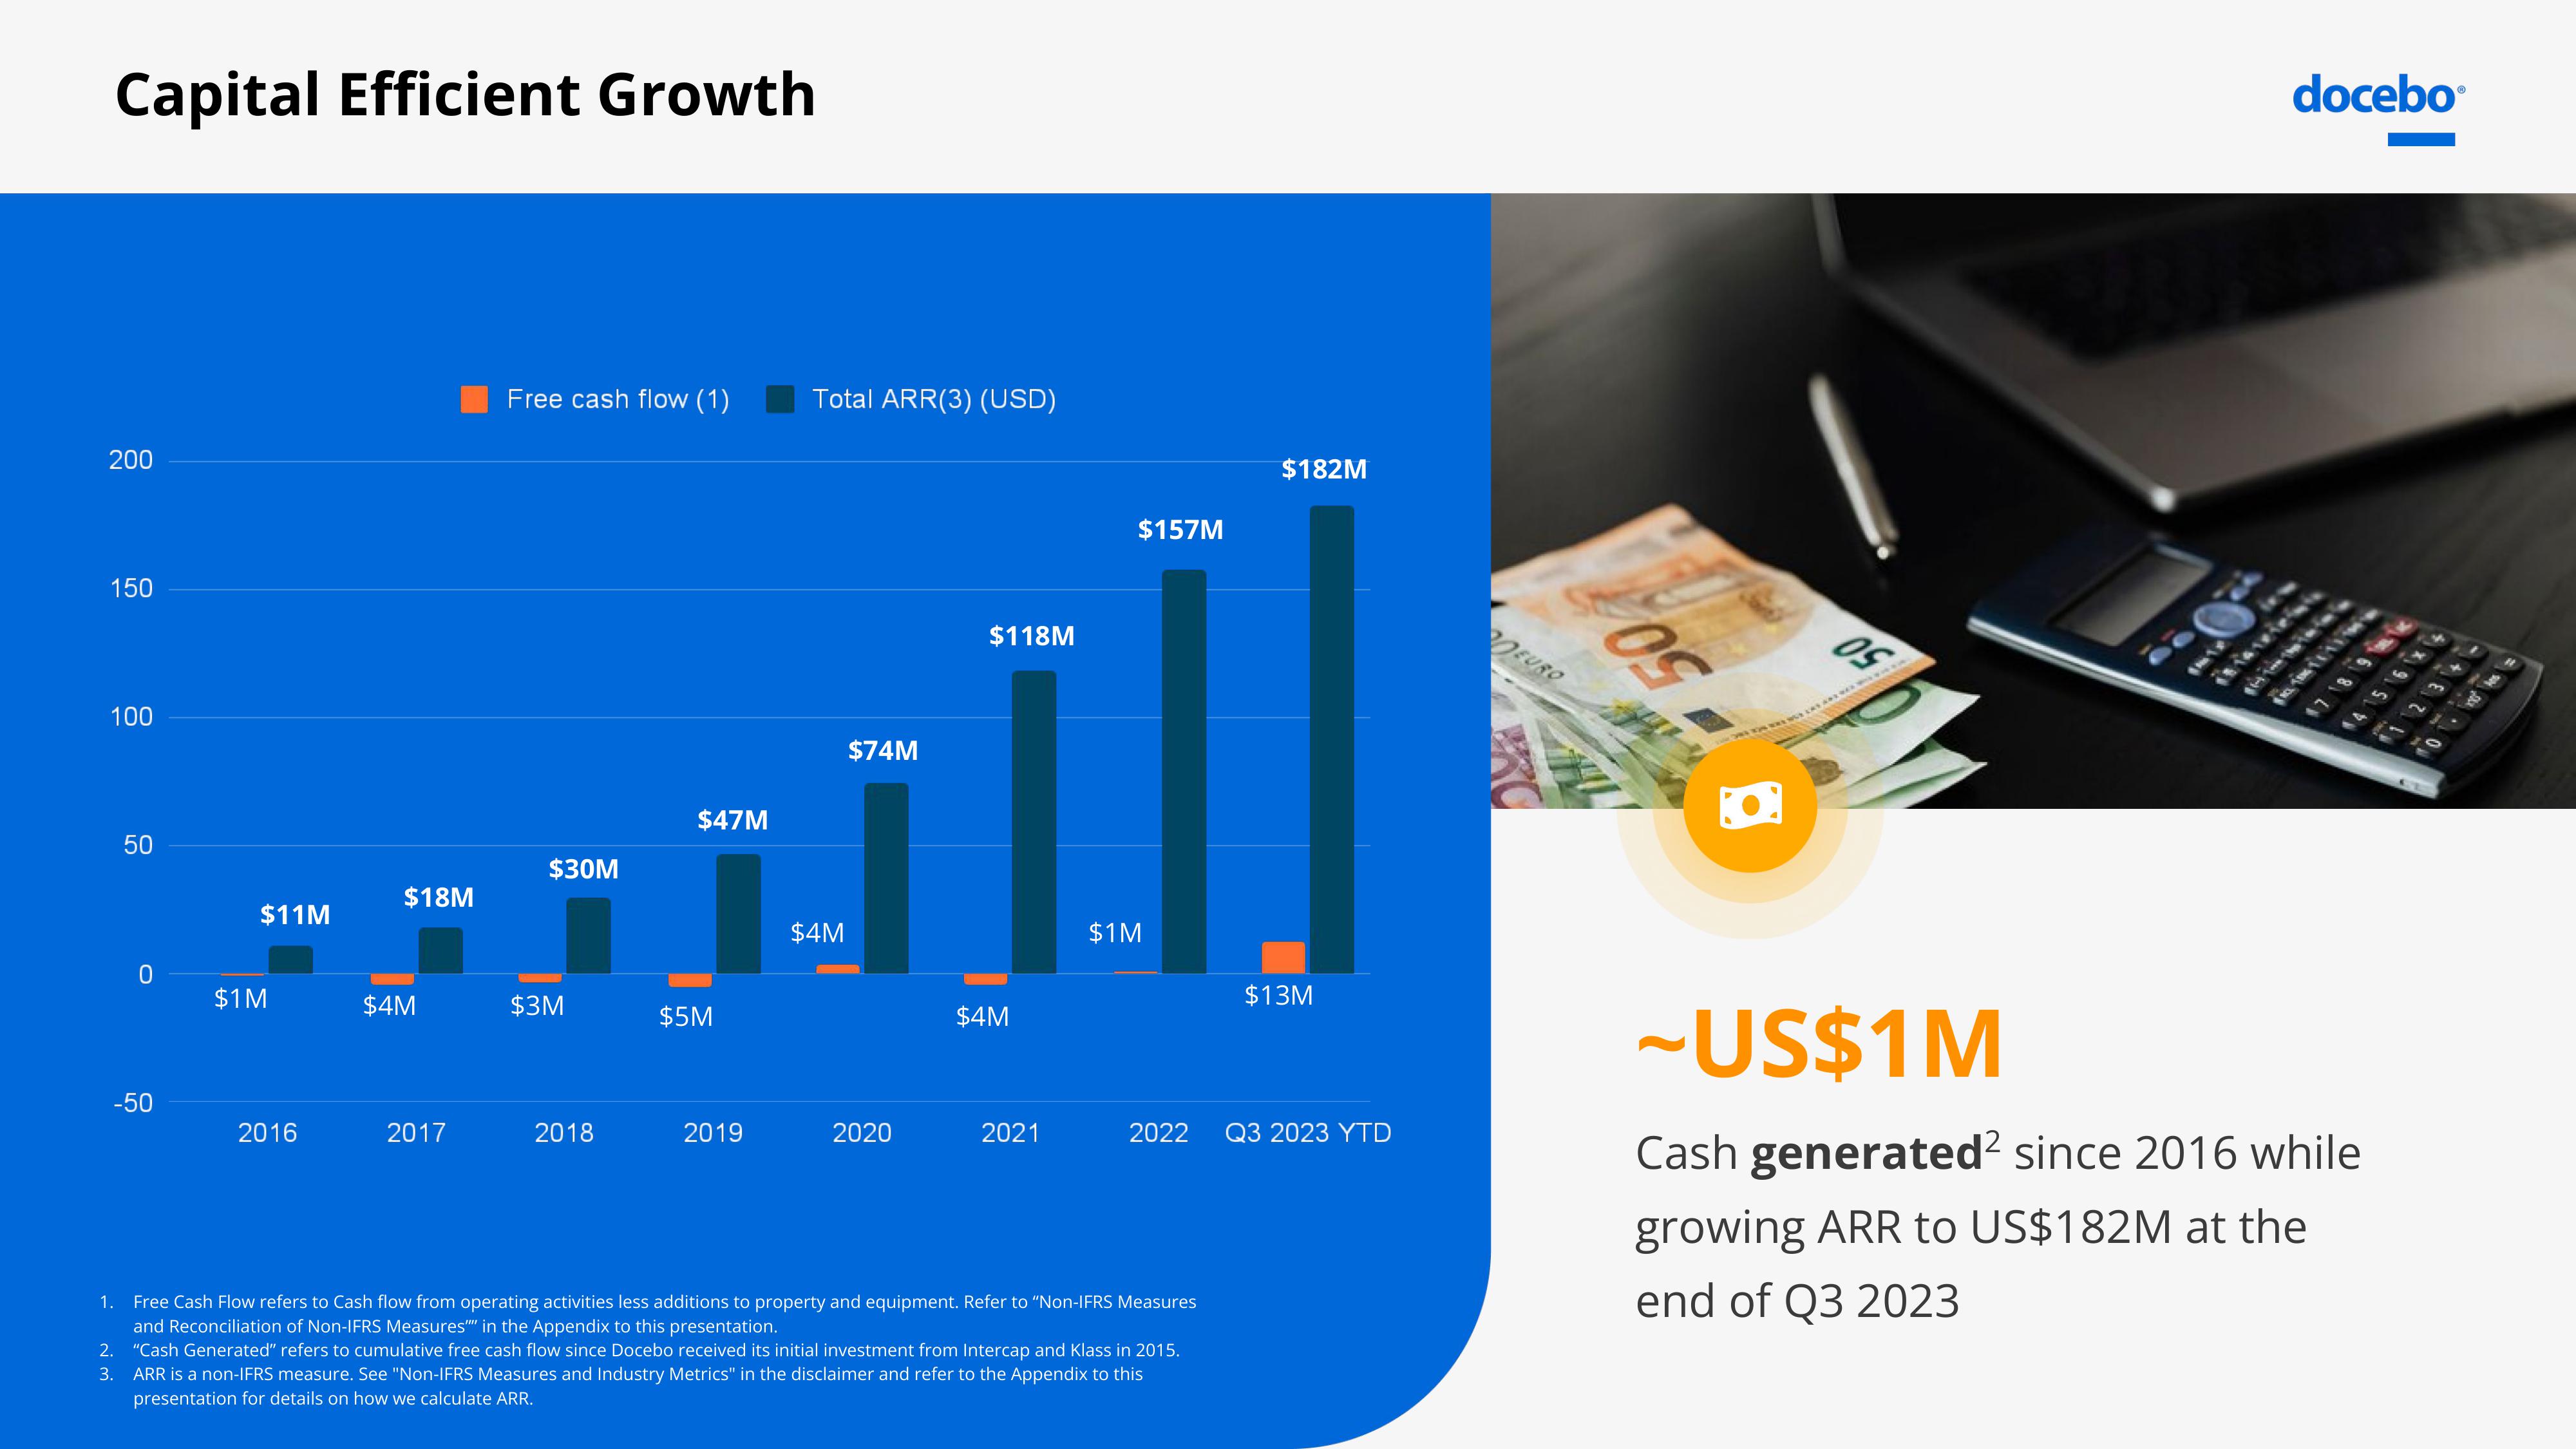
Capital Efficient Growth
200
150
100
50
0
-50
$11M
$1M
2016
$18M
$4M
2017
Free cash flow (1)
$30M
$3M
2018
$47M
$5M
2019
Total ARR(3) (USD)
$4M
$74M
2020
$118M
$4M
2021
$157M
$1M
$182M
1. Free Cash Flow refers to Cash flow from operating activities less additions to property and equipment. Refer to "Non-IFRS Measures
and Reconciliation of Non-IFRS Measures" in the Appendix to this presentation.
2. "Cash Generated" refers to cumulative free cash flow since Docebo received its initial investment from Intercap and Klass in 2015.
ARR is a non-IFRS measure. See "Non-IFRS Measures and Industry Metrics" in the disclaimer and refer to the Appendix to this
presentation for details on how we calculate ARR.
3.
$13M
2022 Q3 2023 YTD
EURO
50
1814102
ܫܗܘܢ ܕܚܢ
docebo
To Th111)
~US$1 M
Cash generated² since 2016 while
growing ARR to US$182M at the
end of Q3 2023
in
x
m
~View entire presentation