Unilever Results Presentation Deck
Unilever
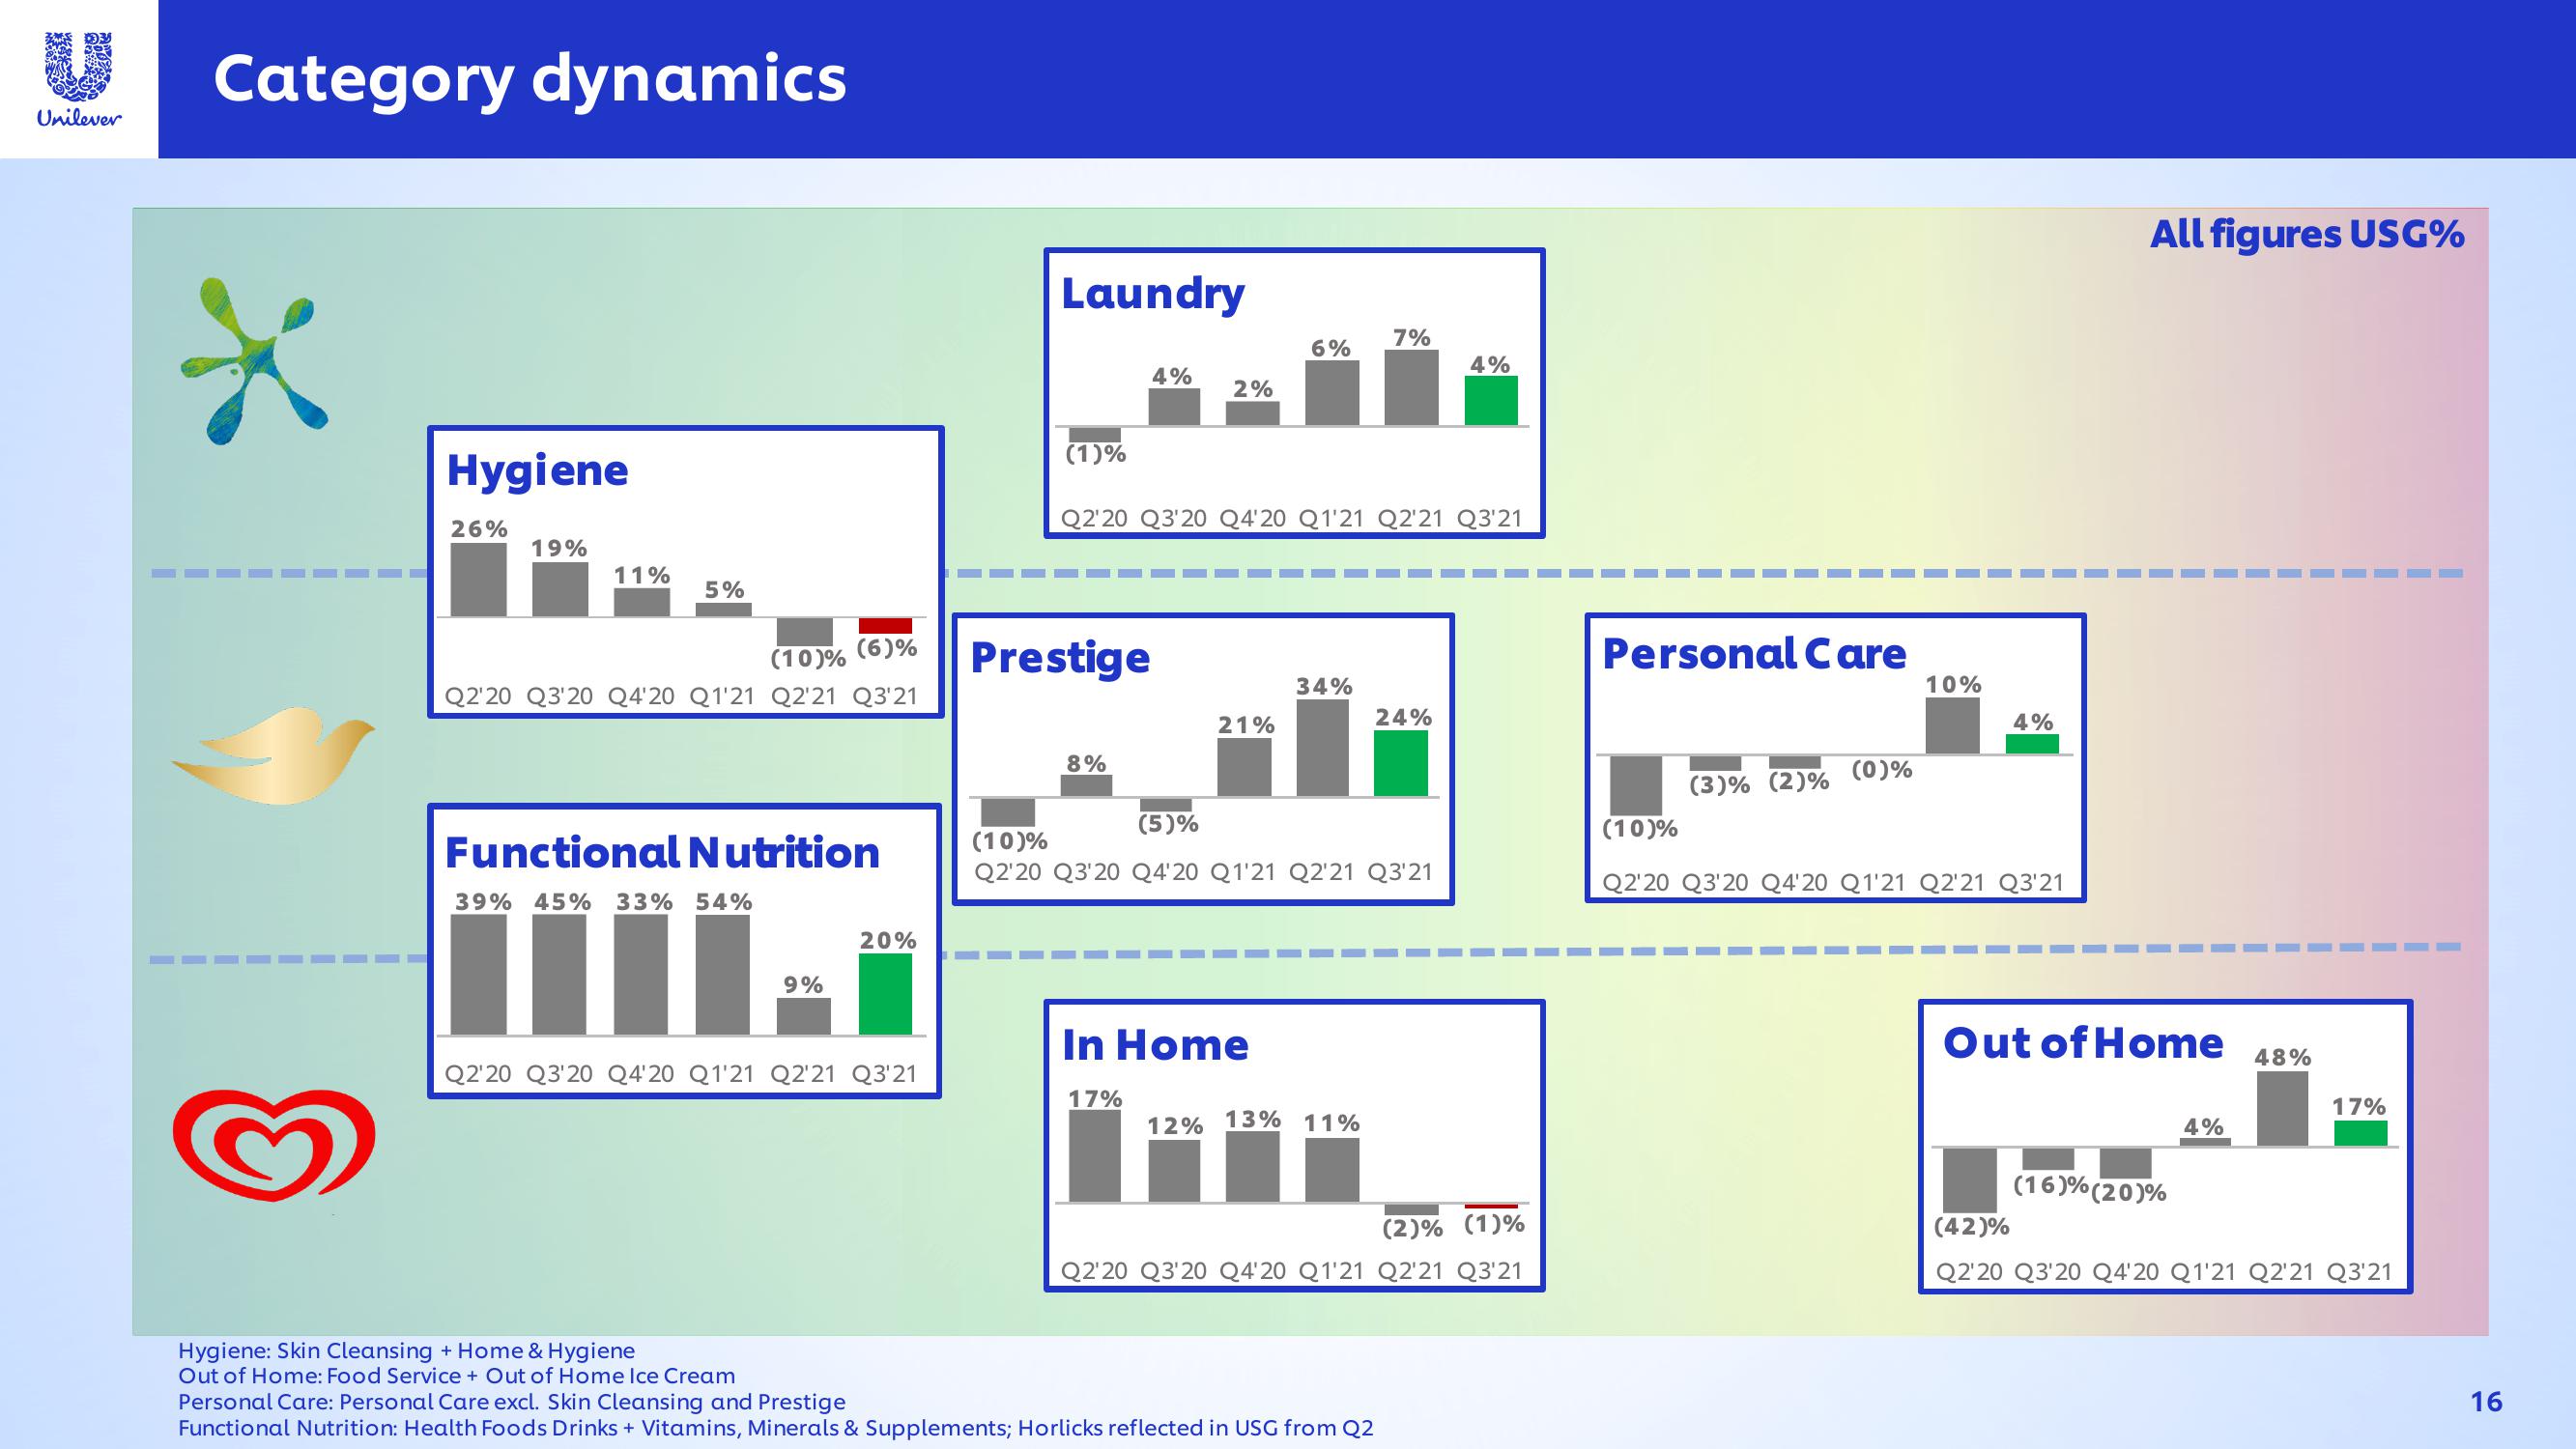
Category dynamics
*
Hygiene
26%
19%
11%
5%
(10)% (6)%
Q2'20 Q3'20 Q4'20 Q1'21 Q2'21 Q3'21
Functional Nutrition
39% 45% 33% 54%
III
Q2'20 Q3'20 Q4'20 Q1'21 Q2'21 Q3'21
Hygiene: Skin Cleansing + Home & Hygiene
Out of Home: Food Service + Out of Home Ice Cream
9%
20%
Laundry
(1)%
4%
Prestige
8%
2%
Q2'20 Q3'20 Q4'20 Q1'21 Q2'21 Q3'21
21%
6%
In Home
17%
34%
7%
(5)%
(10)%
Q2'20 Q3'20 Q4'20 Q1'21 Q2'21 Q3'21
12% 13% 11%
24%
Personal Care: Personal Care excl. Skin Cleansing and Prestige
Functional Nutrition: Health Foods Drinks + Vitamins, Minerals & Supplements; Horlicks reflected in USG from Q2
4%
(2)% (1)%
Q2'20 Q3'20 Q4'20 Q1'21 Q2'21 Q3'21
Personal Care
10%
(0)%
(3)% (2)%
4%
(10)%
Q2'20 Q3'20 Q4'20 Q1'21 Q2'21 Q3'21
All figures USG%
Out of Home 48%
(16)% (20)%
4%
17%
(42)%
Q2'20 Q3'20 Q4'20 Q1'21 Q2'21 Q3'21
16View entire presentation