Grab SPAC Presentation Deck
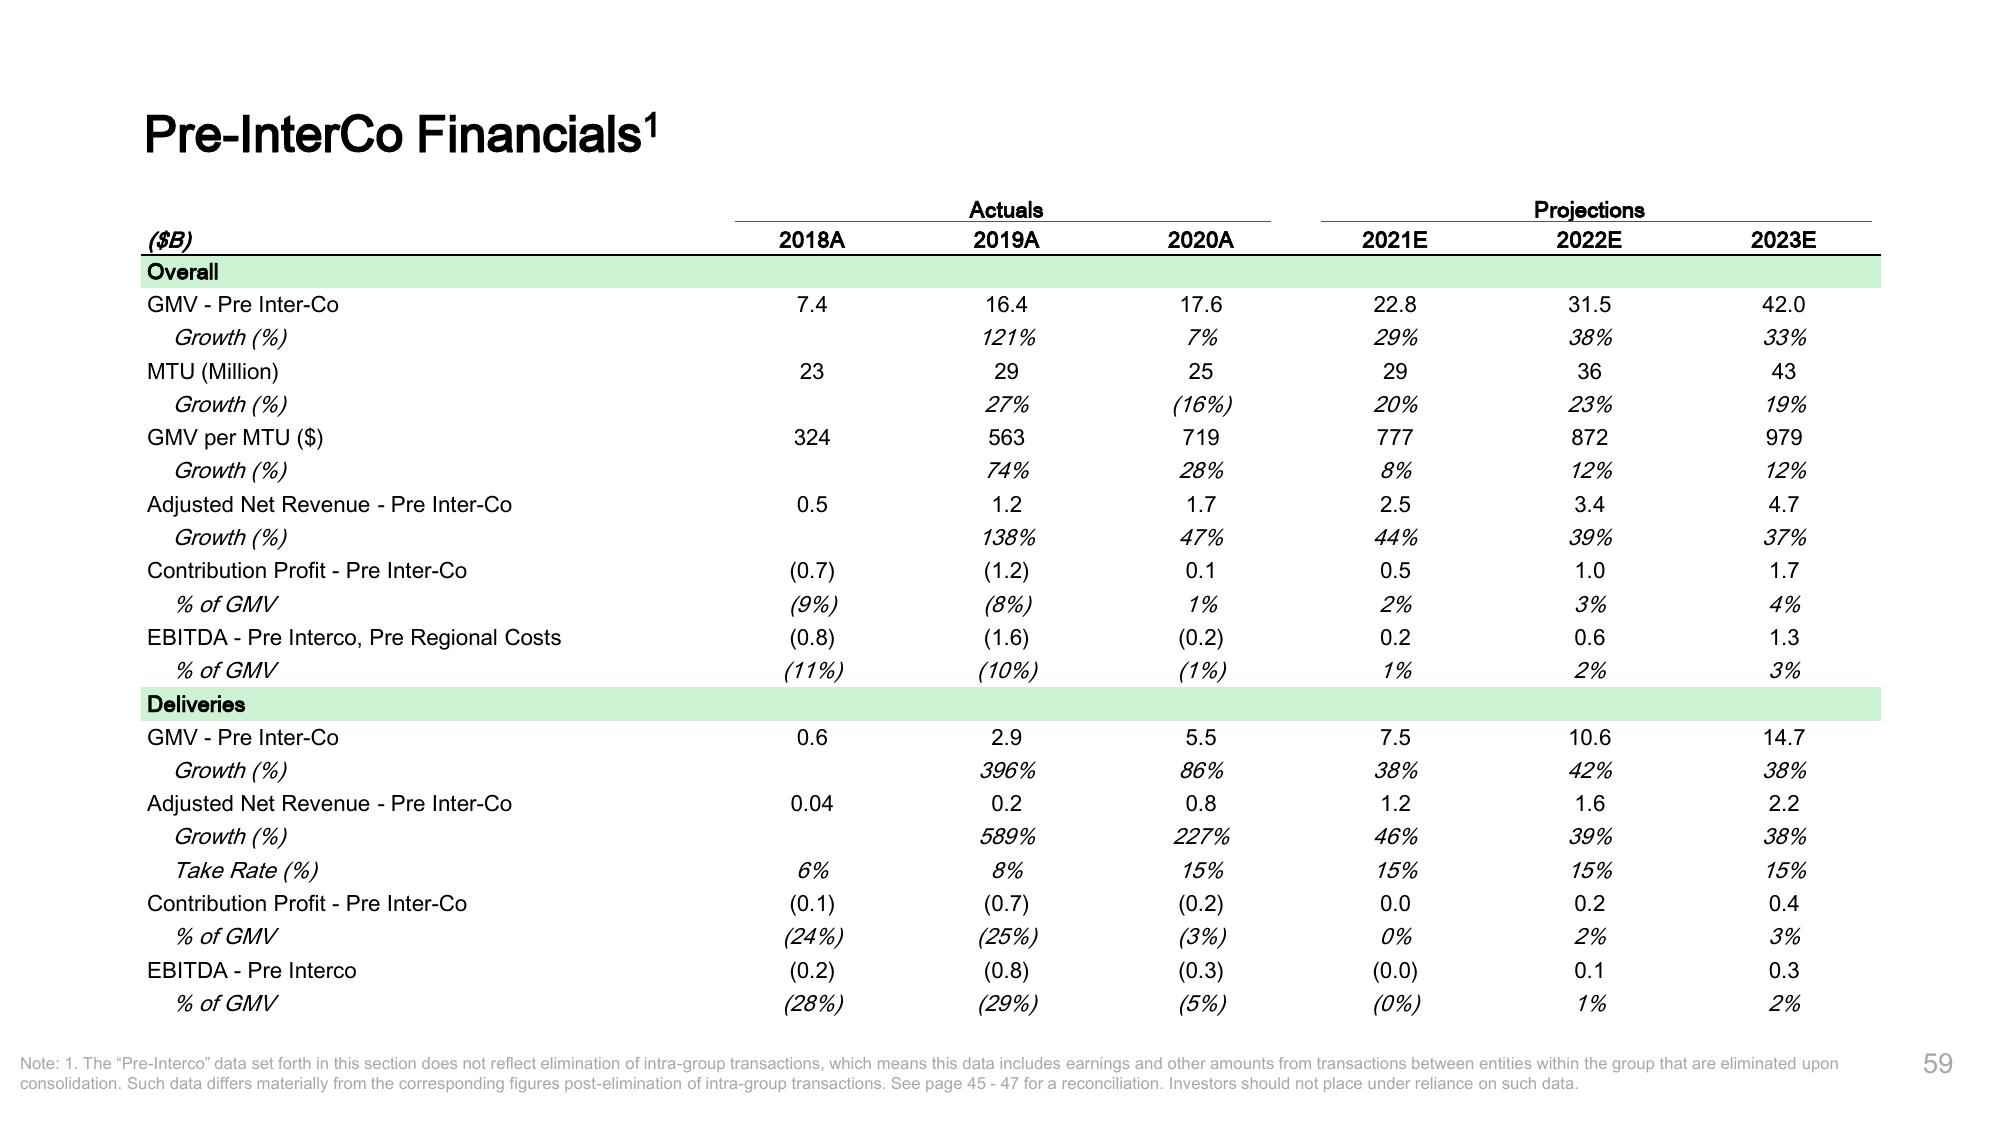
Pre-InterCo Financials¹
($B)
Overall
GMV Pre Inter-Co
Growth (%)
MTU (Million)
Growth (%)
GMV per MTU ($)
Growth (%)
Adjusted Net Revenue - Pre Inter-Co
Growth (%)
Contribution Profit - Pre Inter-Co
% of GMV
EBITDA - Pre Interco, Pre Regional Costs
% of GMV
Deliveries
GMV Pre Inter-Co
Growth (%)
Adjusted Net Revenue - Pre Inter-Co
Growth (%)
Take Rate (%)
Contribution Profit - Pre Inter-Co
% of GMV
EBITDA - Pre Interco
% of GMV
2018A
7.4
23
324
0.5
(0.7)
(9%)
(0.8)
(11%)
0.6
0.04
6%
(0.1)
(24%)
(0.2)
(28%)
Actuals
2019A
16.4
121%
29
27%
563
74%
1.2
138%
(1.2)
(8%)
(1.6)
(10%)
2.9
396%
0.2
589%
8%
(0.7)
(25%)
(0.8)
(29%)
2020A
17.6
7%
25
(16%)
719
28%
1.7
47%
0.1
1%
(0.2)
(1%)
5.5
86%
0.8
227%
15%
(0.2)
(3%)
(0.3)
(5%)
2021E
22.8
29%
29
20%
777
8%
2.5
44%
0.5
2%
0.2
1%
7.5
38%
1.2
46%
15%
0.0
0%
(0.0)
(0%)
Projections
2022E
31.5
38%
36
23%
872
12%
3.4
39%
1.0
3%
0.6
2%
10.6
42%
1.6
39%
15%
0.2
2%
0.1
1%
2023E
42.0
33%
43
19%
979
12%
4.7
37%
1.7
4%
1.3
3%
14.7
38%
2.2
38%
15%
0.4
3%
0.3
2%
Note: 1. The "Pre-Interco" data set forth in this section does not reflect elimination of intra-group transactions, which means this data includes earnings and other amounts from transactions between entities within the group that are eliminated upon
consolidation. Such data differs materially from the corresponding figures post-elimination of intra-group transactions. See page 45-47 for a reconciliation. Investors should not place under reliance on such data.
59View entire presentation