Main Street Capital Investor Day Presentation Deck
Alignment of Interests Between
MAIN Management and MAIN Investors
Management Alignment
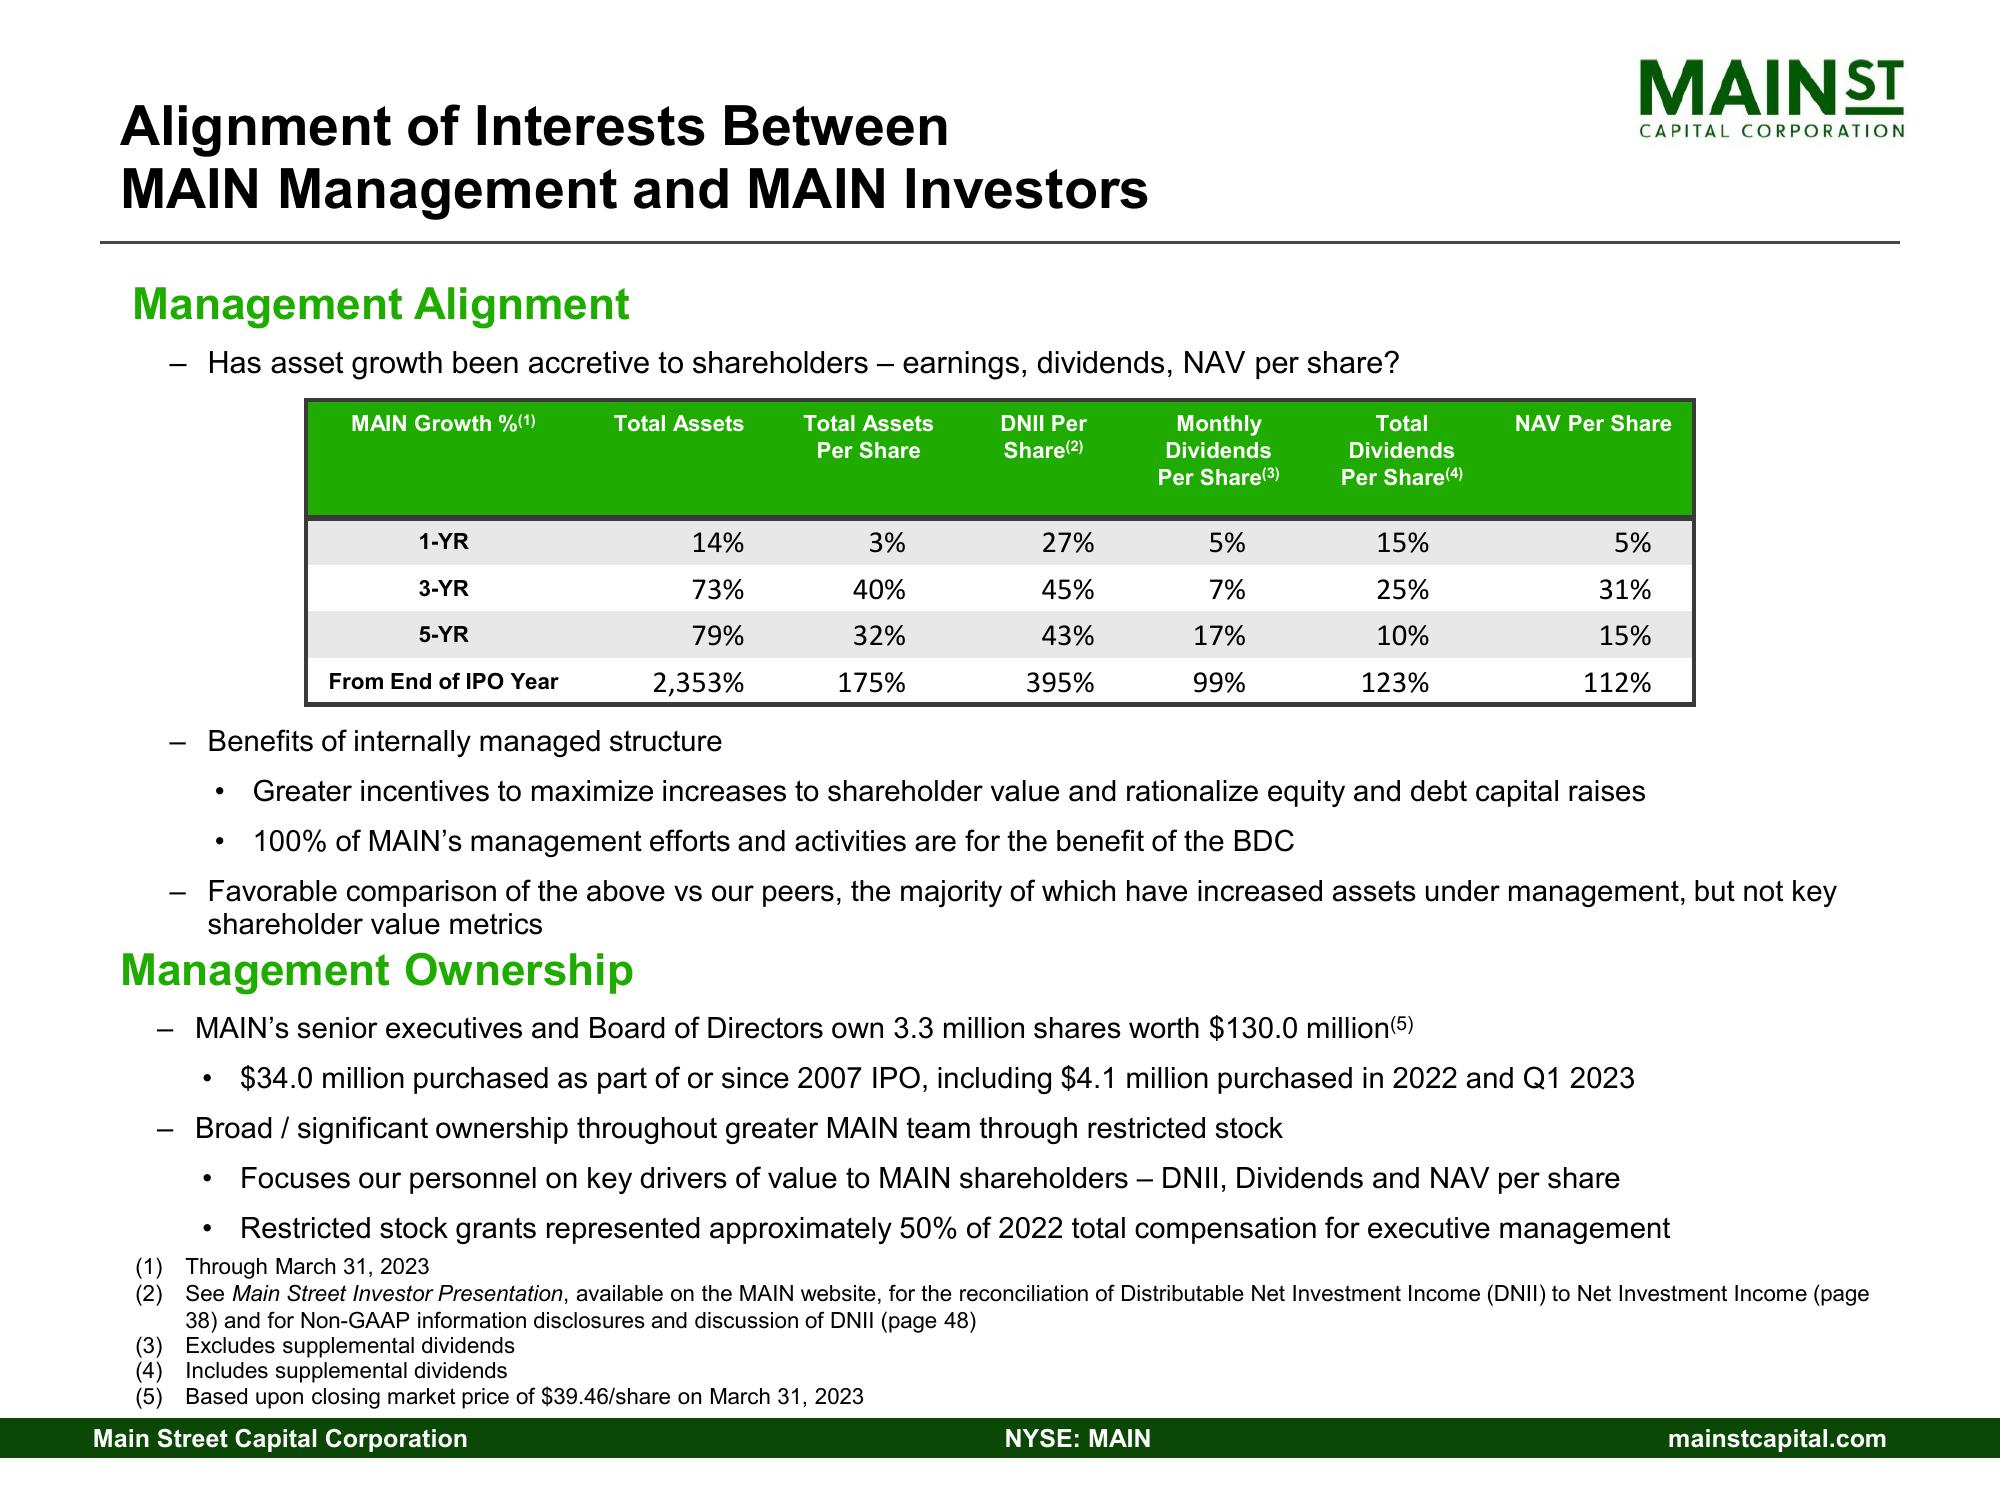
Has asset growth been accretive to shareholders - earnings, dividends, NAV per share?
MAIN Growth %(1)
●
1-YR
3-YR
5-YR
From End of IPO Year
●
Total Assets
14%
73%
79%
2,353%
Total Assets
Per Share
3%
40%
32%
175%
DNII Per
Share(2)
27%
45%
43%
395%
Monthly
Dividends
Per Share (3)
5%
7%
17%
99%
Total
Dividends
Per Share (4)
NYSE: MAIN
15%
25%
10%
123%
MAINST
CAPITAL CORPORATION
Benefits of internally managed structure
Greater incentives to maximize increases to shareholder value and rationalize equity and debt capital raises
•100% of MAIN's management efforts and activities are for the benefit of the BDC
Favorable comparison of the above vs our peers, the majority of which have increased assets under management, but not key
shareholder value metrics
Management Ownership
MAIN's senior executives and Board of Directors own 3.3 million shares worth $130.0 million (5)
NAV Per Share
$34.0 million purchased as part of or since 2007 IPO, including $4.1 million purchased in 2022 and Q1 2023
Broad / significant ownership throughout greater MAIN team through restricted stock
Focuses our personnel on key drivers of value to MAIN shareholders - DNII, Dividends and NAV per share
Restricted stock grants represented approximately 50% of 2022 total compensation for executive management
(1) Through March 31, 2023
(2)
5%
31%
15%
112%
See Main Street Investor Presentation, available on the MAIN website, for the reconciliation of Distributable Net Investment Income (DNII) to Net Investment Income (page
38) and for Non-GAAP information disclosures and discussion of DNII (page 48)
(3) Excludes supplemental dividends
(4) Includes supplemental dividends
(5) Based upon closing market price of $39.46/share on March 31, 2023
Main Street Capital Corporation
mainstcapital.comView entire presentation