HBT Financial Results Presentation Deck
1) Consistent performance through cycles. . .
Drivers of Profitability
1
2
3
4
Strong, granular, low-cost
deposits supported by our
leading market share in our
Central Illinois markets
HBT
Financial
Relationship-based business
model that has allowed us to
cultivate and underwrite
attractively priced loans
A robust credit risk management
framework to prudently manage
credit quality
Diversified sources of fee
income, including in wealth
management
3.00%
2.75%
2.50%
2.25%
2.00%
1.75%
1.50%
1.25%
1.00%
0.75%
0.50%
0.25%
0.00%
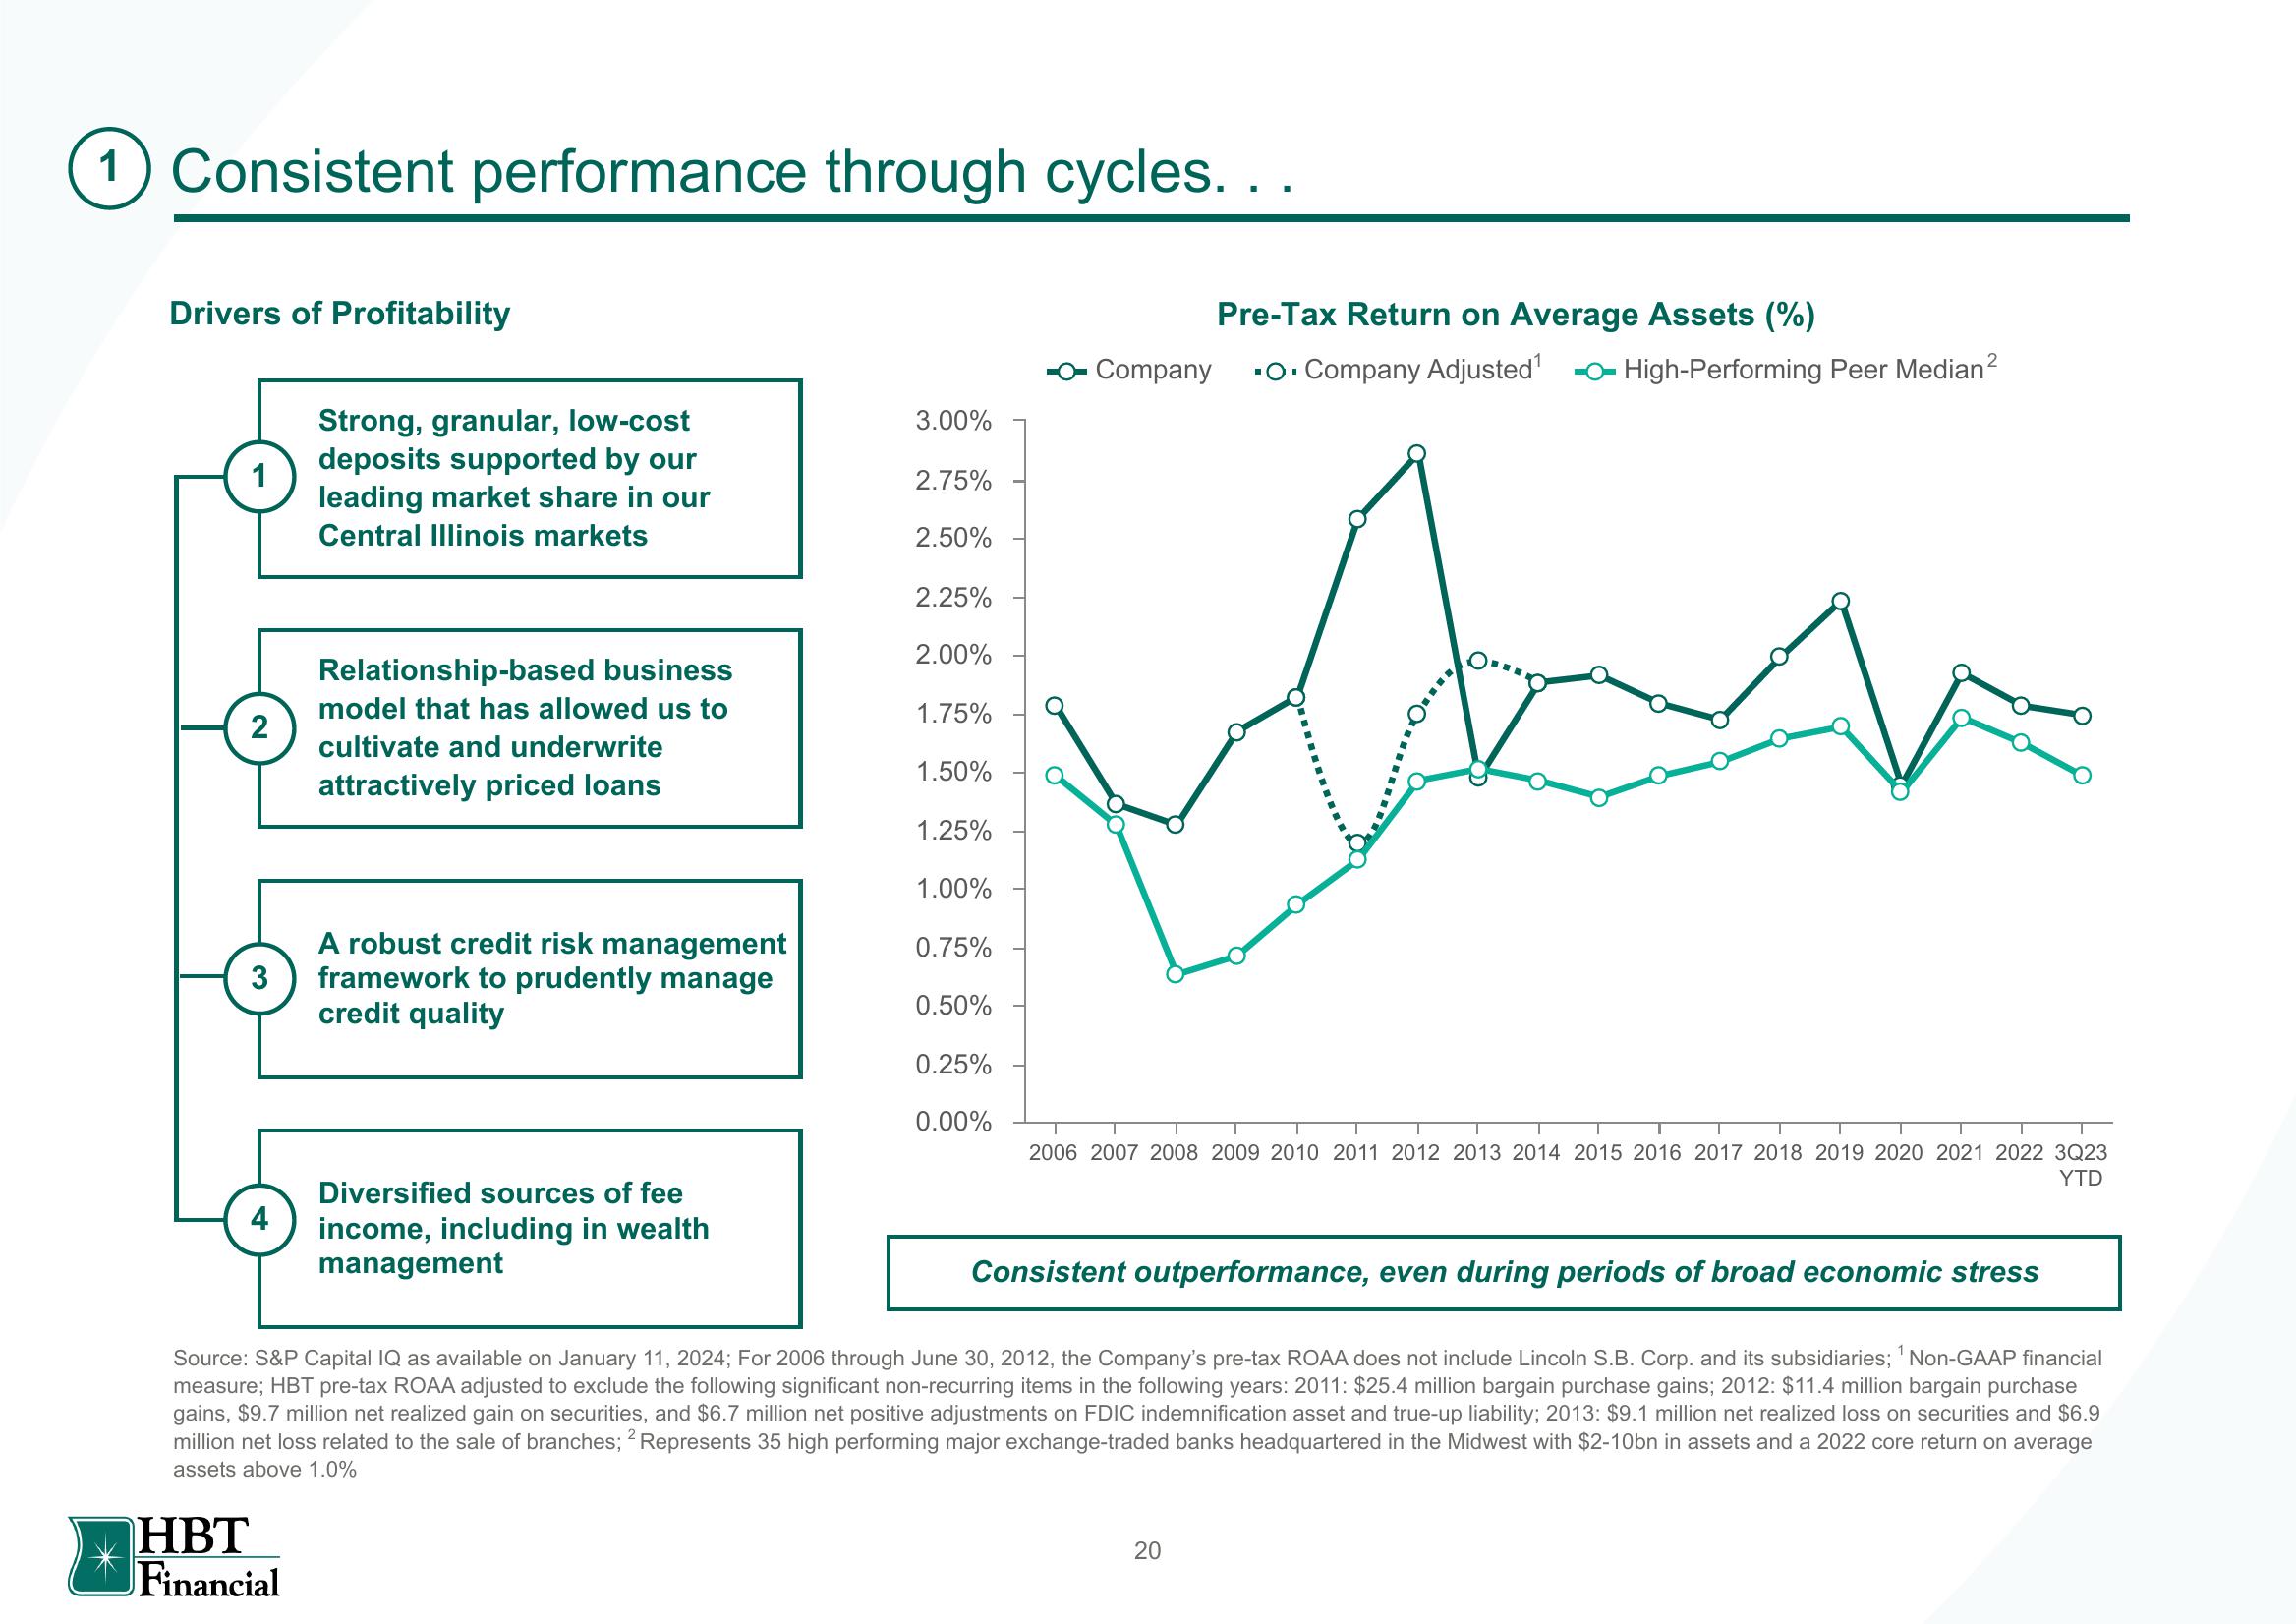
Pre-Tax Return on Average Assets (%)
-- Company ▪O. Company Adjusted¹ - High-Performing Peer Median²
han
2006 2007 2008 2009 2010 2011 2012 2013 2014 2015 2016 2017 2018 2019 2020 2021 2022 3Q23
YTD
Consistent outperformance, even during periods of broad economic stress
Source: S&P Capital IQ as available on January 11, 2024; For 2006 through June 30, 2012, the Company's pre-tax ROAA does not include Lincoln S.B. Corp. and its subsidiaries; Non-GAAP financial
measure; HBT pre-tax ROAA adjusted to exclude the following significant non-recurring items in the following years: 2011: $25.4 million bargain purchase gains; 2012: $11.4 million bargain purchase
gains, $9.7 million net realized gain on securities, and $6.7 million net positive adjustments on FDIC indemnification asset and true-up liability; 2013: $9.1 million net realized loss on securities and $6.9
million net loss related to the sale of branches; 2 Represents 35 high performing major exchange-traded banks headquartered in the Midwest with $2-10bn in assets and a 2022 core return on average
assets above 1.0%
1
20View entire presentation