Corecentric Investor Presentation Deck
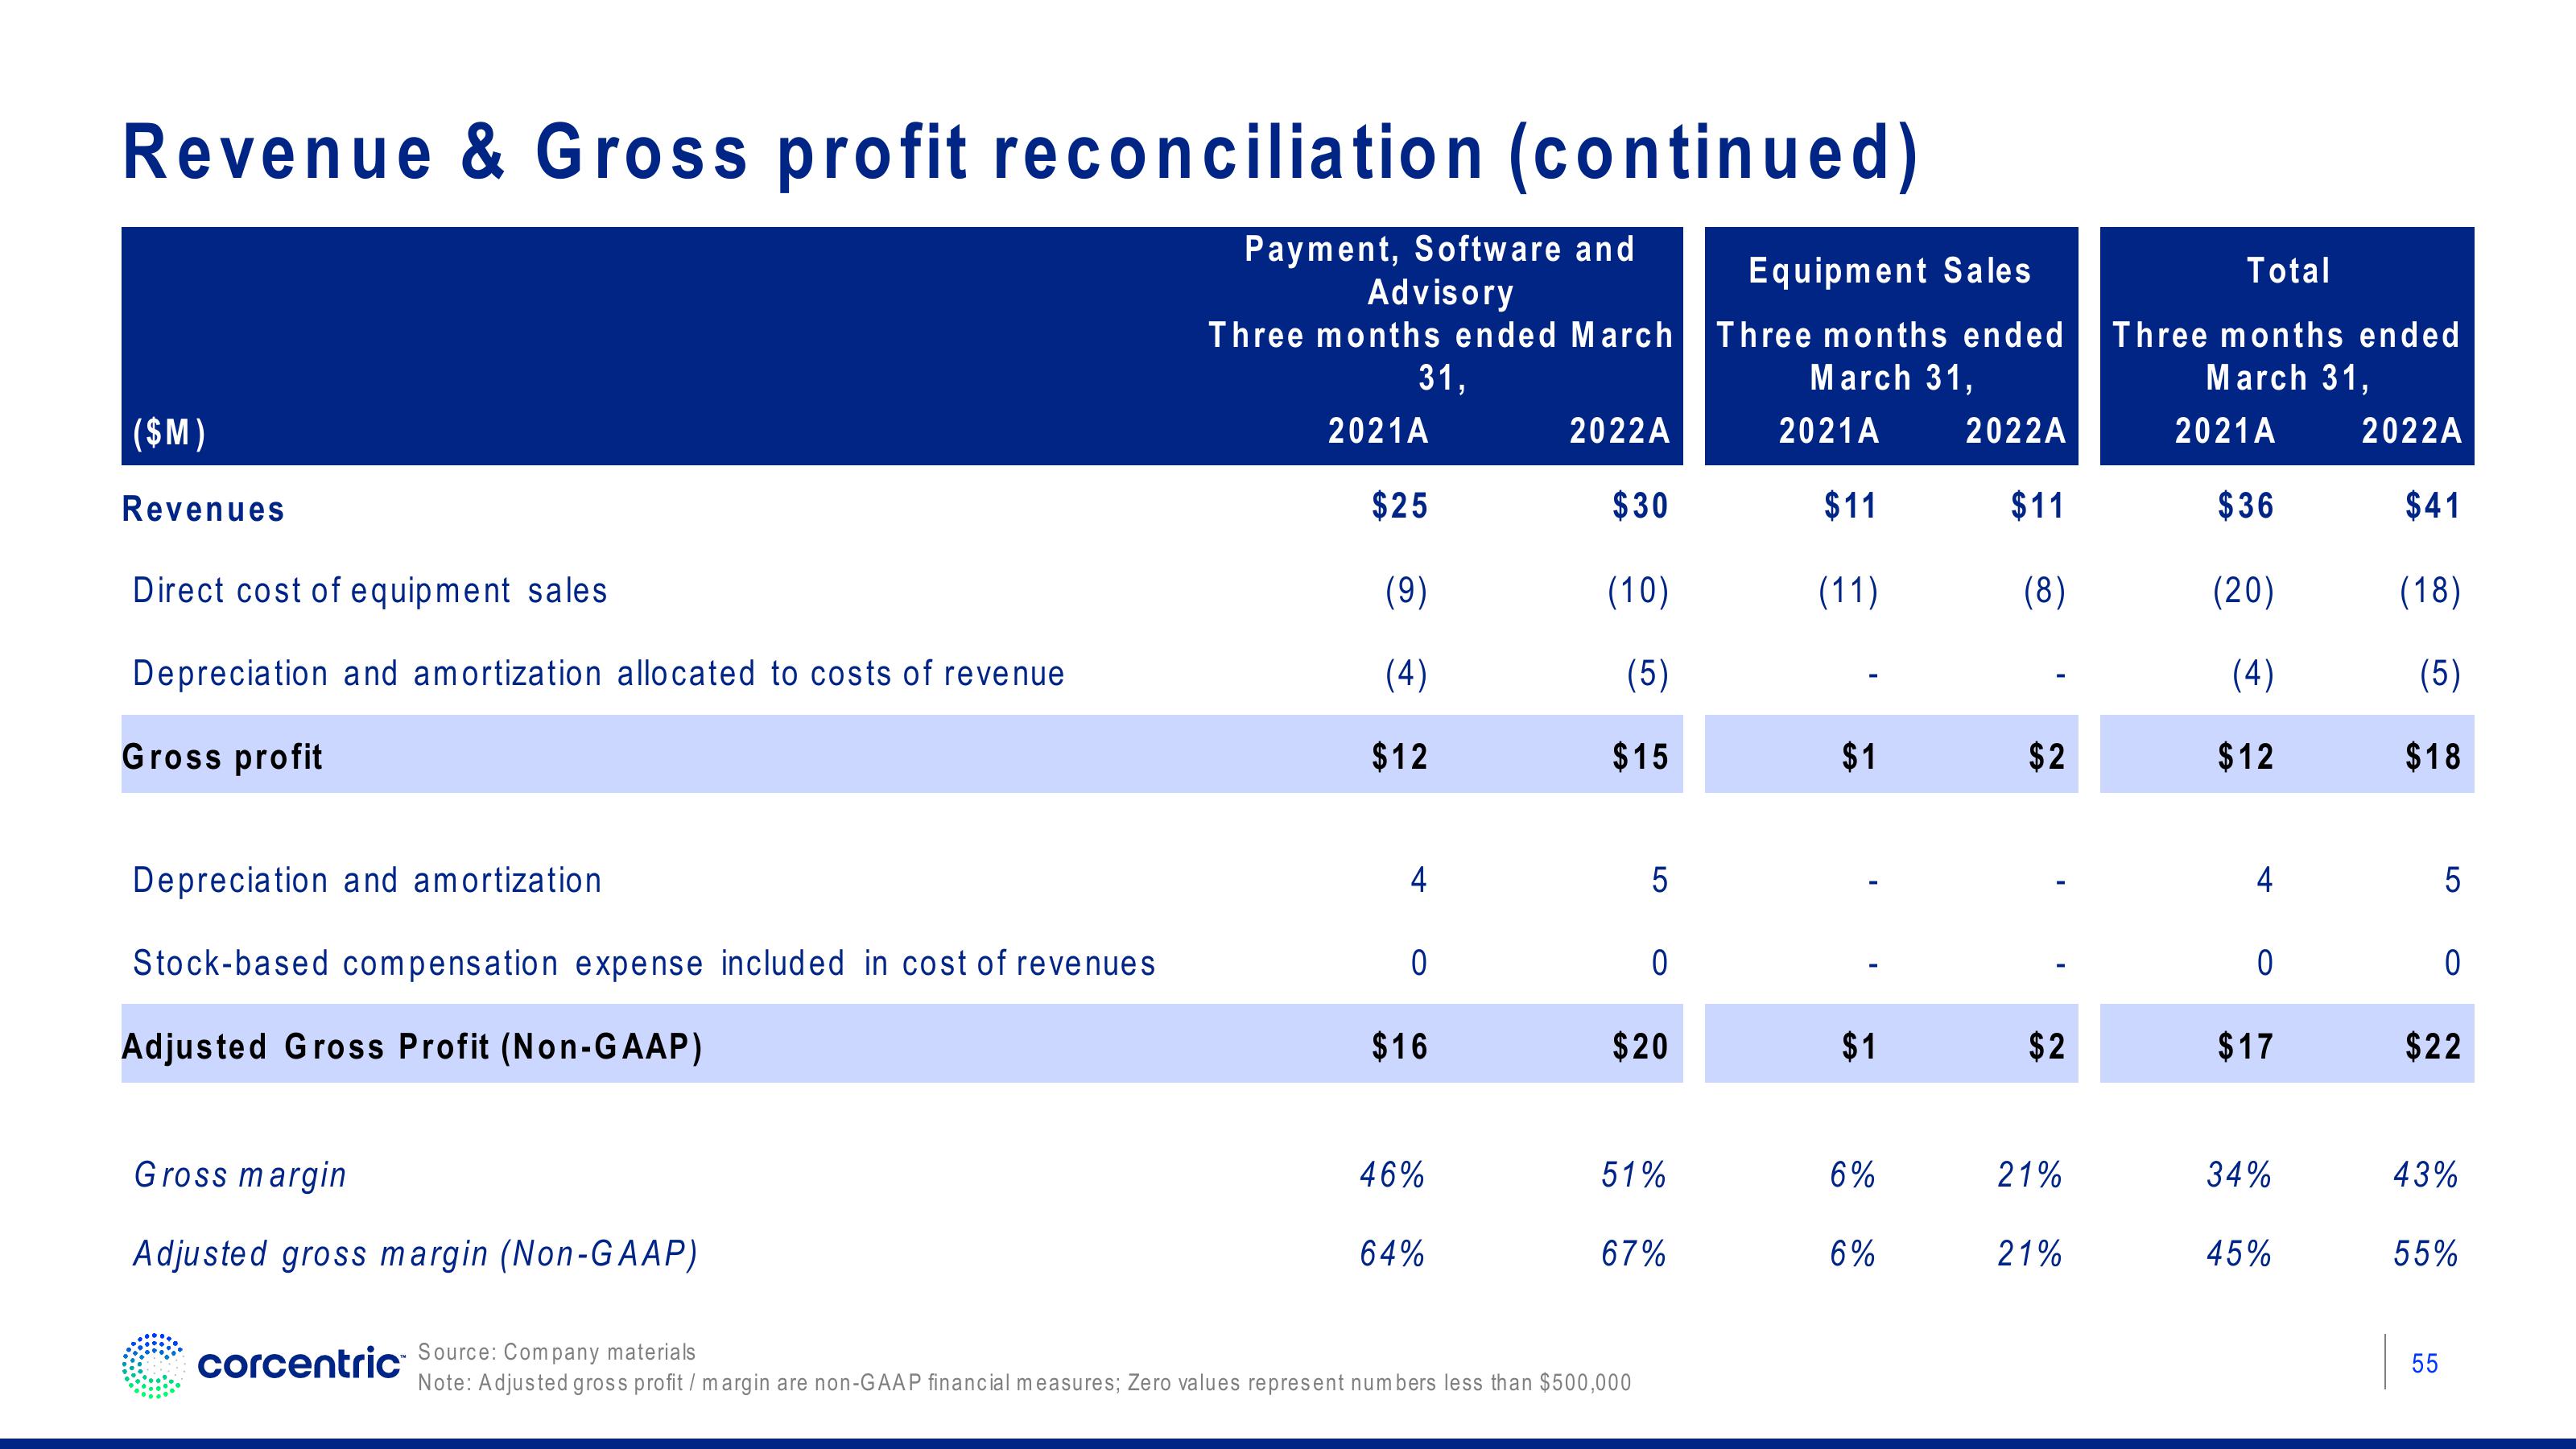
Revenue & Gross profit reconciliation (continued)
Payment, Software and
Advisory
Three months ended March
31,
($M)
Revenues
Direct cost of equipment sales
Depreciation and amortization allocated to costs of revenue
Gross profit
Depreciation and amortization
Stock-based compensation expense included in cost of revenues
Adjusted Gross Profit (Non-GAAP)
Gross margin
Adjusted gross margin (Non-GAAP)
corcentric
2021A
$25
(9)
(4)
$12
4
0
$16
46%
64%
2022A
$30
(10)
(5)
$15
5
0
$20
51%
Source: Company materials
Note: Adjusted gross profit / margin are non-GAAP financial measures; Zero values represent numbers less than $500,000
67%
Equipment Sales
Three months ended
March 31,
2021A
$11
(11)
$1
$1
6%
6%
2022A
$11
(8)
$2
$2
21%
21%
Total
Three months ended
March 31,
2021A
$36
(20)
(4)
$12
4
0
$17
34%
45%
2022A
$41
(18)
(5)
$18
5
0
$22
43%
55
55%View entire presentation