Silicon Valley Bank Results Presentation Deck
Enhance client
experience
●
●
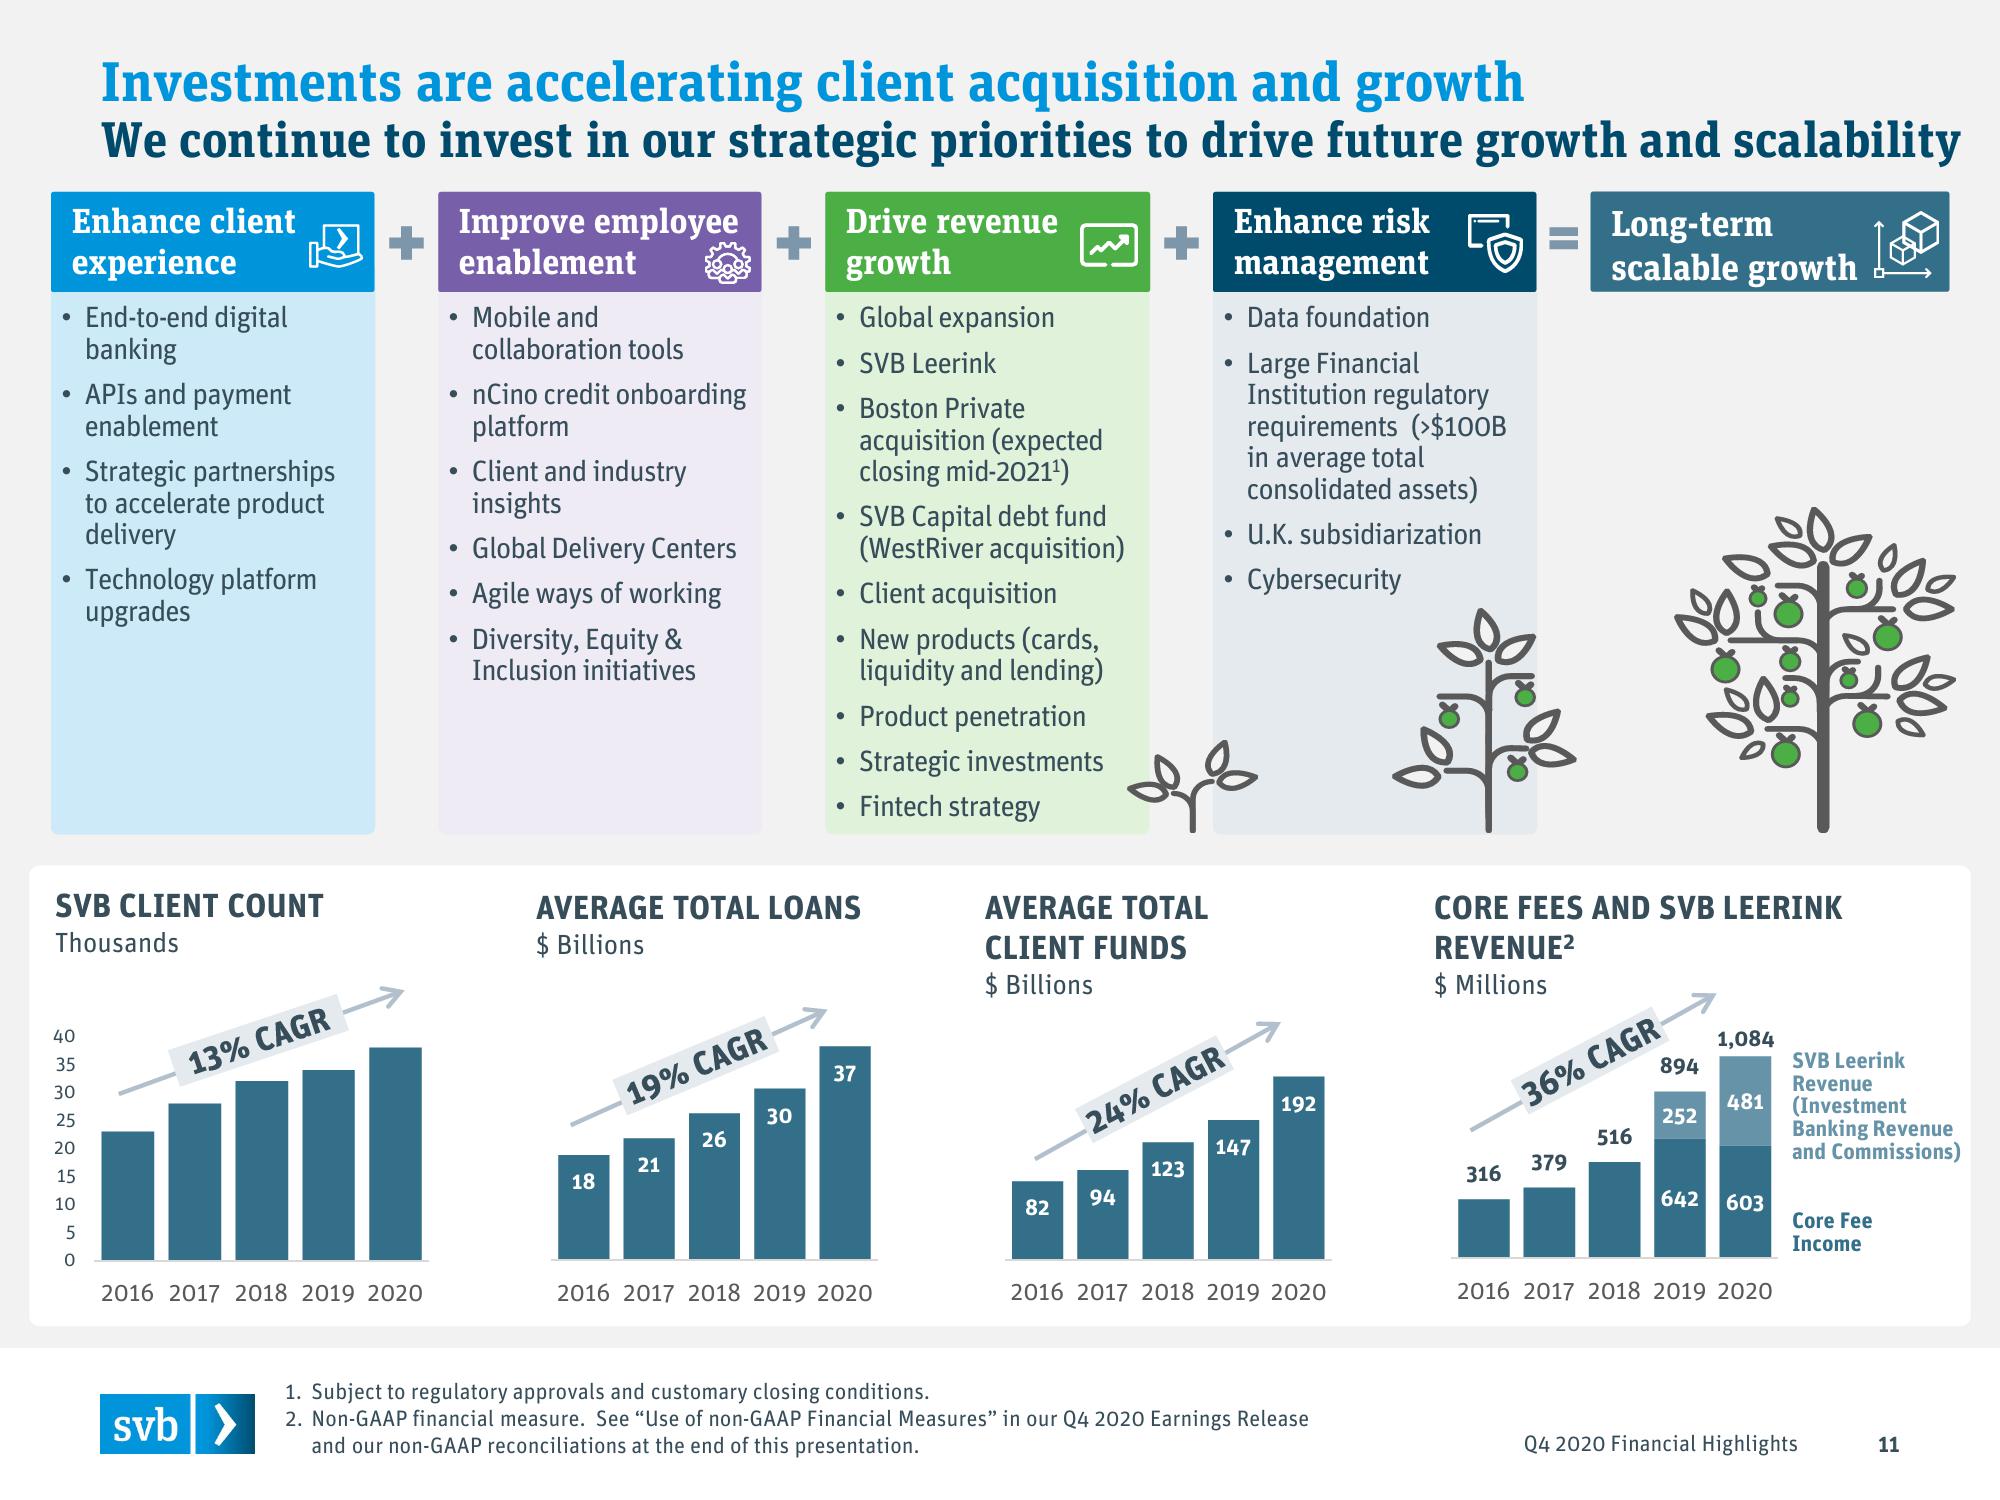
Investments are accelerating client acquisition and growth
We continue to invest in our strategic priorities to drive future growth and scalability
+
40
35
30
25
20
15
10
5
0
End-to-end digital
banking
APIs and payment
enablement
Strategic partnerships
to accelerate product
delivery
Technology platform
upgrades
SVB CLIENT COUNT
Thousands
13% CAGR
2016 2017 2018 2019 2020
svb >
Improve employee
enablement
●
●
●
●
●
Mobile and
collaboration tools
nCino credit onboarding
platform
Client and industry
insights
Global Delivery Centers
Agile ways of working
Diversity, Equity &
Inclusion initiatives
18
19% CAGR
21
26
Drive revenue
growth
Global expansion
SVB Leerink
30
●
●
• Boston Private
acquisition (expected
closing mid-2021¹)
SVB Capital debt fund
(WestRiver acquisition)
●
AVERAGE TOTAL LOANS
$ Billions
●
●
• Strategic investments
Fintech strategy
●
Client acquisition
New products (cards,
liquidity and lending)
Product penetration
37
2016 2017 2018 2019 2020
AVERAGE TOTAL
CLIENT FUNDS
$ Billions
82
94
Enhance risk
management
●
123
.
дв
●
●
-24% CAGR
Data foundation
Large Financial
Institution regulatory
requirements (>$100B
in average total
consolidated assets)
U.K. subsidiarization
Cybersecurity
147
192
2016 2017 2018 2019 2020
1. Subject to regulatory approvals and customary closing conditions.
2. Non-GAAP financial measure. See "Use of non-GAAP Financial Measures" in our Q4 2020 Earnings Release
and our non-GAAP reconciliations at the end of this presentation.
CORE FEES AND SVB LEERINK
REVENUE²
$ Millions
316
Long-term
scalable growth
379
-36% CAGR
894
516
252
642
1,084
SVB Leerink
Revenue
481 (Investment
603
2016 2017 2018 2019 2020
Banking Revenue
and Commissions)
Core Fee
Income
Q4 2020 Financial Highlights
11View entire presentation