Nexters Results Presentation Deck
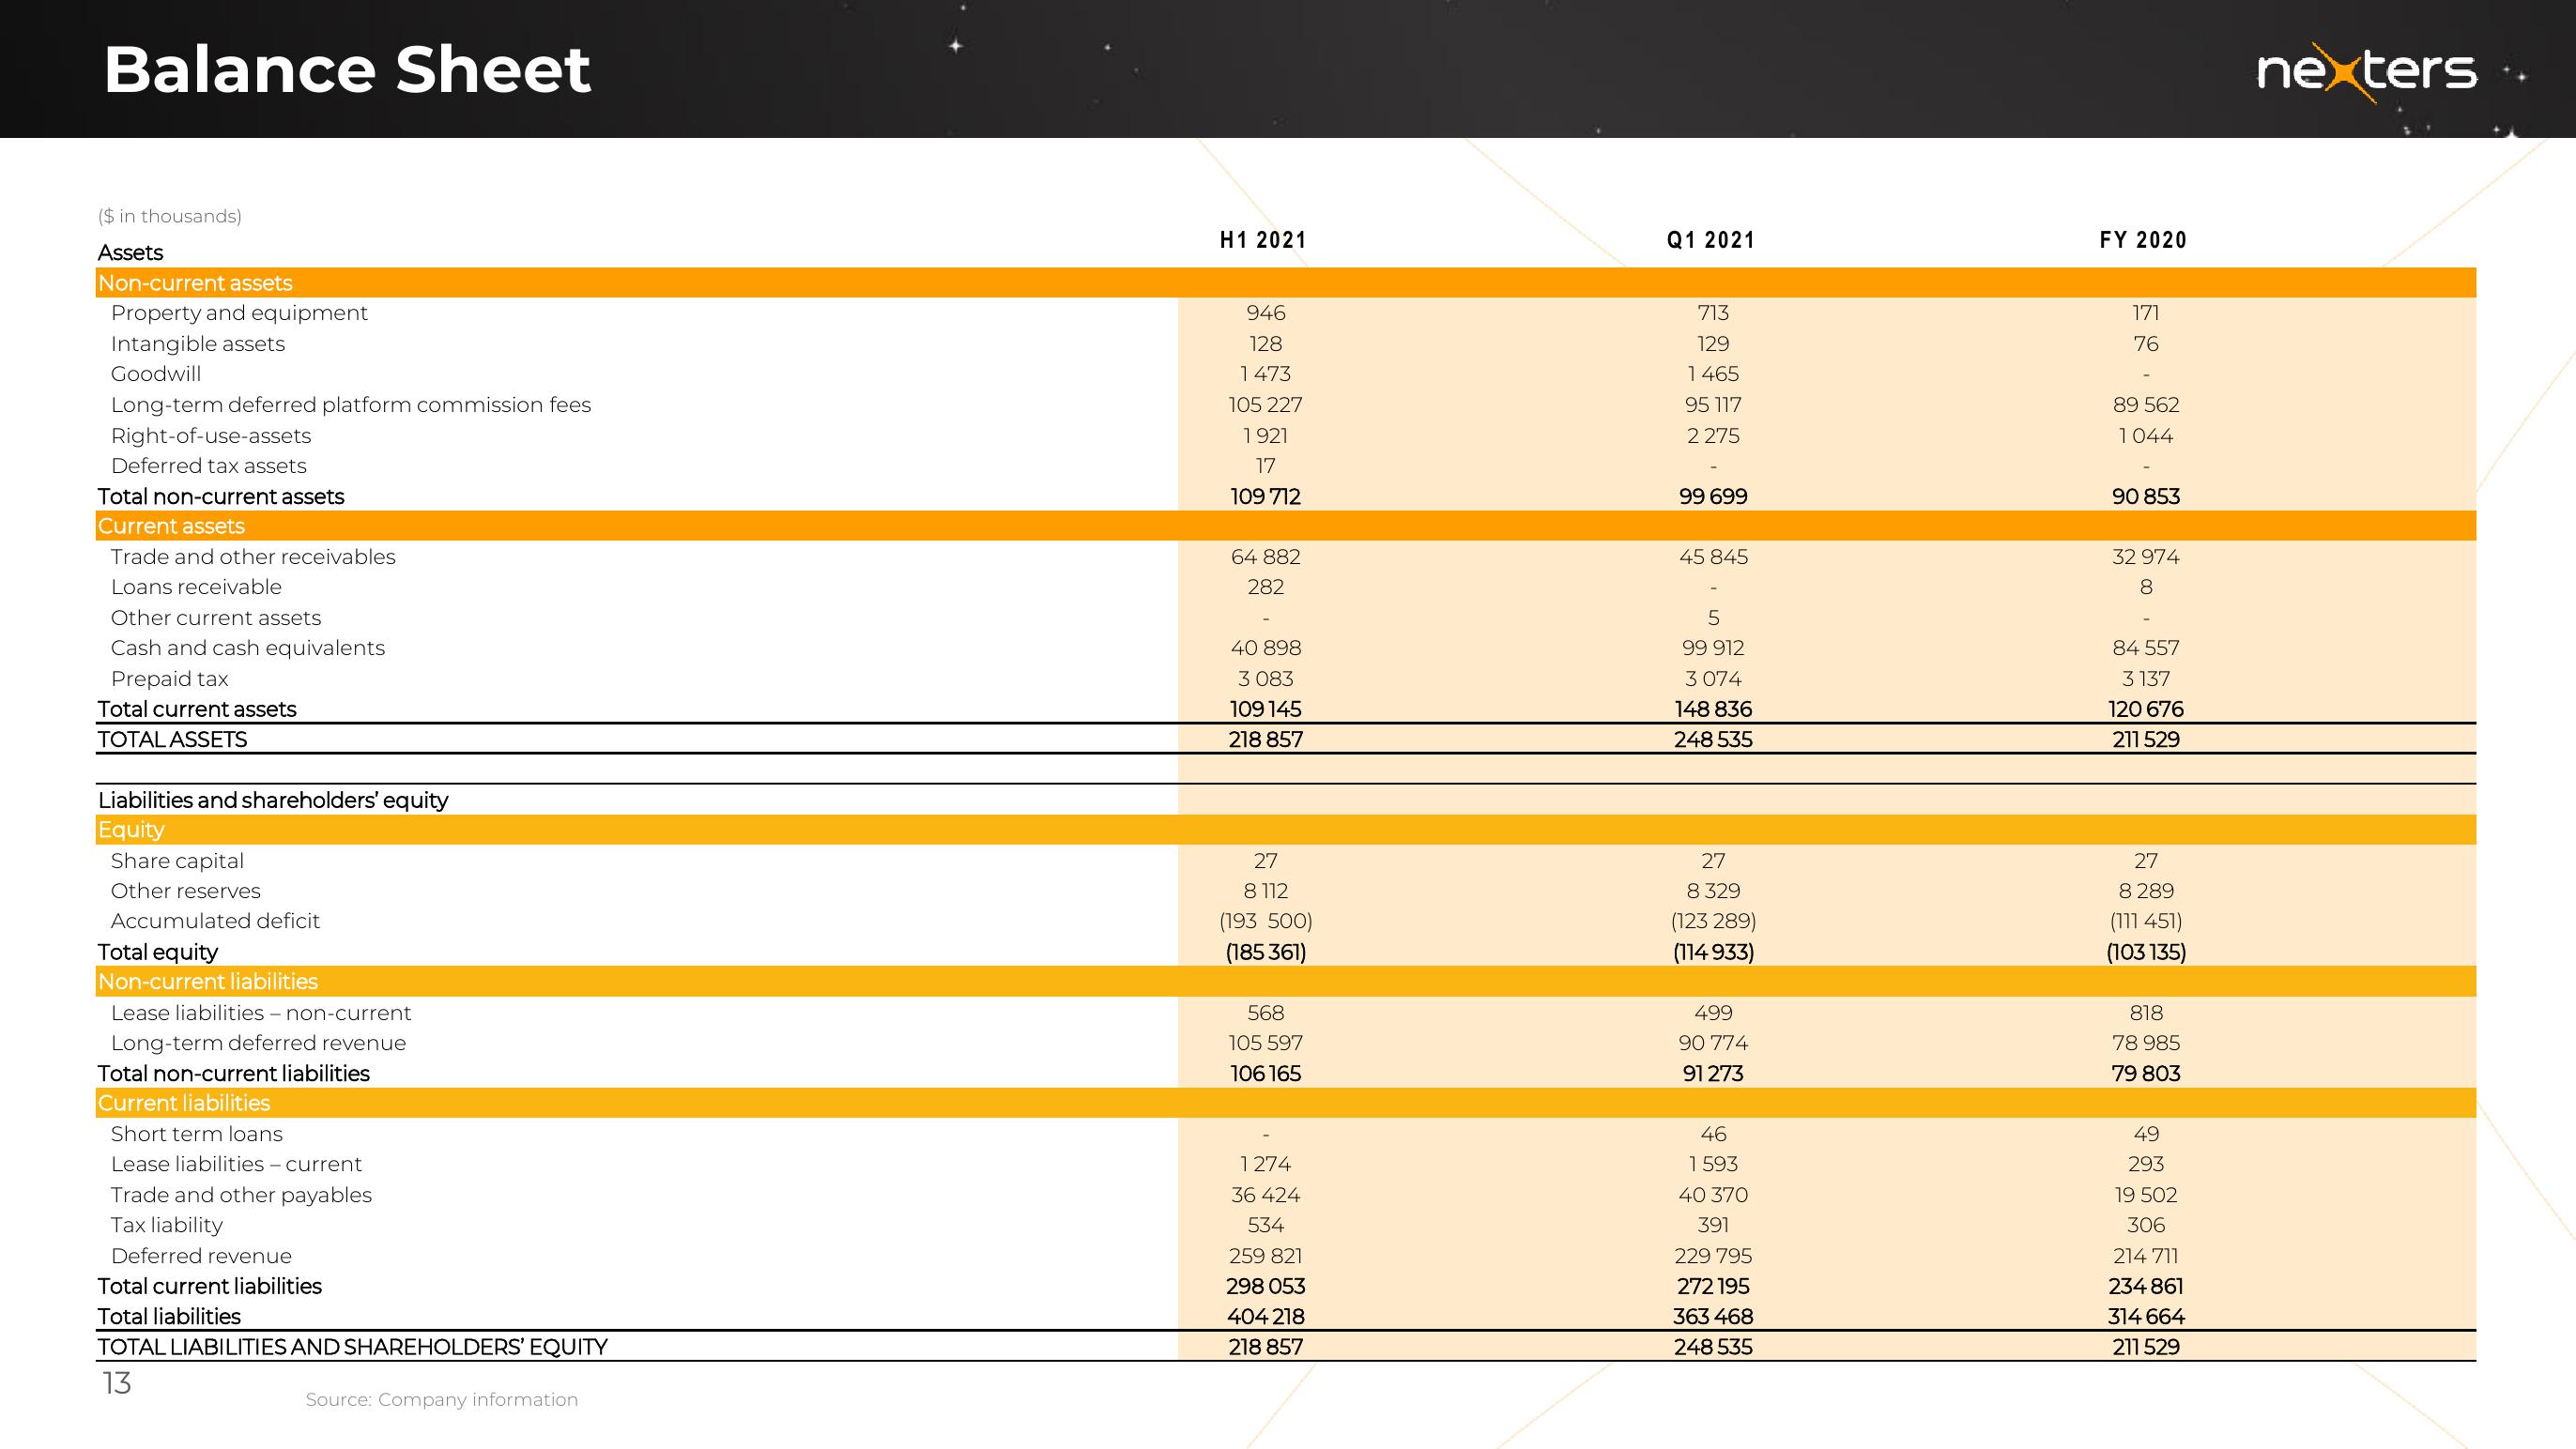
Balance Sheet
($ in thousands)
Assets
Non-current assets
Property and equipment
Intangible assets
Goodwill
Long-term deferred platform commission fees
Right-of-use-assets
Deferred tax assets
Total non-current assets
Current assets
Trade and other receivables
Loans receivable
Other current assets
Cash and cash equivalents
Prepaid tax
Total current assets
TOTAL ASSETS
Liabilities and shareholders' equity
Equity
Share capital
Other reserves
Accumulated deficit
Total equity
Non-current liabilities
Lease liabilities - non-current
Long-term deferred revenue
Total non-current liabilities
Current liabilities
Short term loans
Lease liabilities - current
Trade and other payables
Tax liability
Deferred revenue
Total current liabilities
Total liabilities
TOTAL LIABILITIES AND SHAREHOLDERS' EQUITY
13
Source: Company information
H1 2021
946
128
1473
105 227
1921
17
109 712
64 882
282
40 898
3 083
109 145
218 857
27
8112
(193 500)
(185 361)
568
105 597
106 165
1274
36 424
534
259 821
298 053
404 218
218 857
Q1 2021
713
129
1465
95 117
2275
99 699
45 845
5
99 912
3074
148 836
248 535
27
8 329
(123 289)
(114 933)
499
90 774
91 273
46
1593
40 370
391
229 795
272 195
363 468
248 535
FY 2020
171
76
89 562
1044
90 853
32 974
8
84 557
3137
120 676
211 529
27
8 289
(111 451)
(103 135)
818
78 985
79 803
49
293
19 502
306
214 711
234 861
314 664
211 529
nexters.View entire presentation