Circut Results Presentation Deck
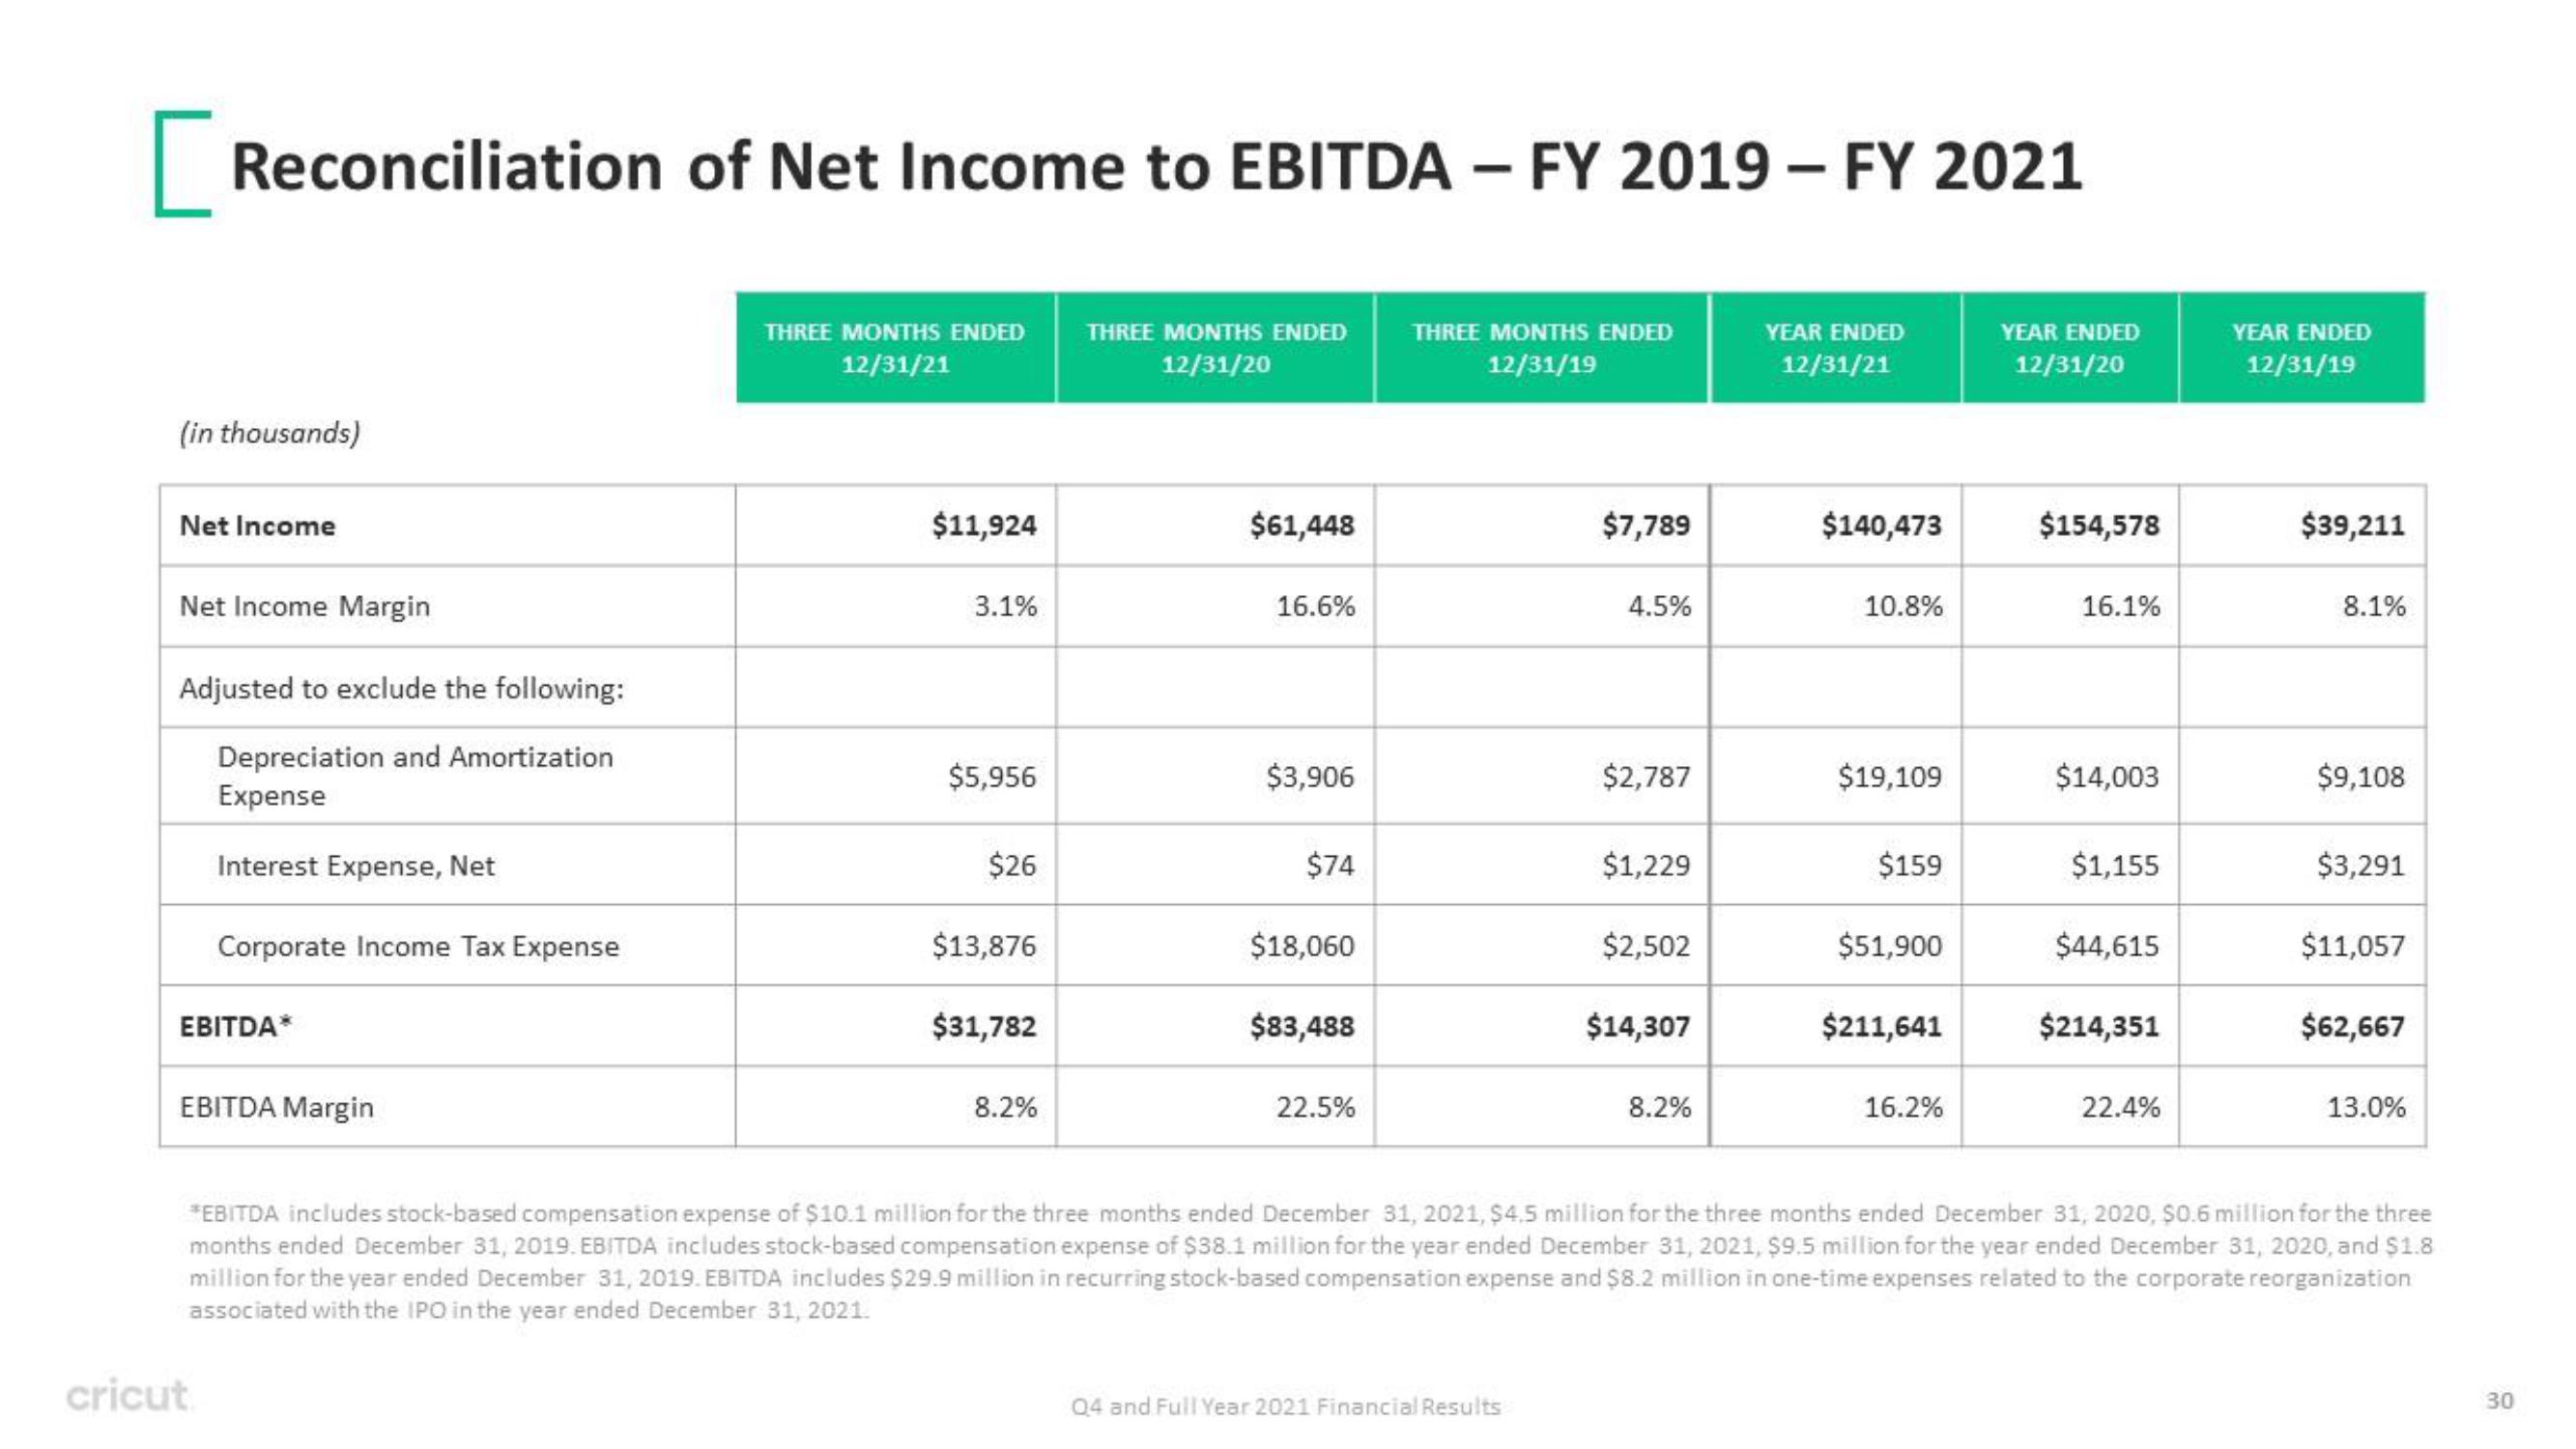
[Reconciliation of Net Income to EBITDA - FY 2019 - FY 2021
(in thousands)
Net Income
Net Income Margin
Adjusted to exclude the following:
Depreciation and Amortization
Expense
Interest Expense, Net
Corporate Income Tax Expense
EBITDA*
EBITDA Margin
cricut
THREE MONTHS ENDED THREE MONTHS ENDED
12/31/21
12/31/20
$11,924
3.1%
$5,956
$26
$13,876
$31,782
8.2%
$61,448
16.6%
$3,906
$74
$18,060
$83,488
22.5%
THREE MONTHS ENDED
12/31/19
$7,789
04 and Full Year 2021 Financial Results
4.5%
$2,787
$1,229
$2,502
$14,307
8.2%
YEAR ENDED
12/31/21
$140,473
10.8%
$19,109
$159
$51,900
$211,641
16.2%
YEAR ENDED
12/31/20
$154,578
16.1%
$14,003
$1,155
$44,615
$214,351
22.4%
YEAR ENDED
12/31/19
$39,211
8.1%
$9,108
$3,291
$11,057
$62,667
*EBITDA includes stock-based compensation expense of $10.1 million for the three months ended December 31, 2021, $4.5 million for the three months ended December 31, 2020, $0.6 million for the three
months ended December 31, 2019. EBITDA includes stock-based compensation expense of $38.1 million for the year ended December 31, 2021, $9.5 million for the year ended December 31, 2020, and $1.8
million for the year ended December 31, 2019. EBITDA includes $29.9 million in recurring stock-based compensation expense and $8.2 million in one-time expenses related to the corporate reorganization
associated with the IPO in the year ended December 31, 2021.
13.0%
30View entire presentation