Grab Results Presentation Deck
Mobility
Increasing our active driver supply
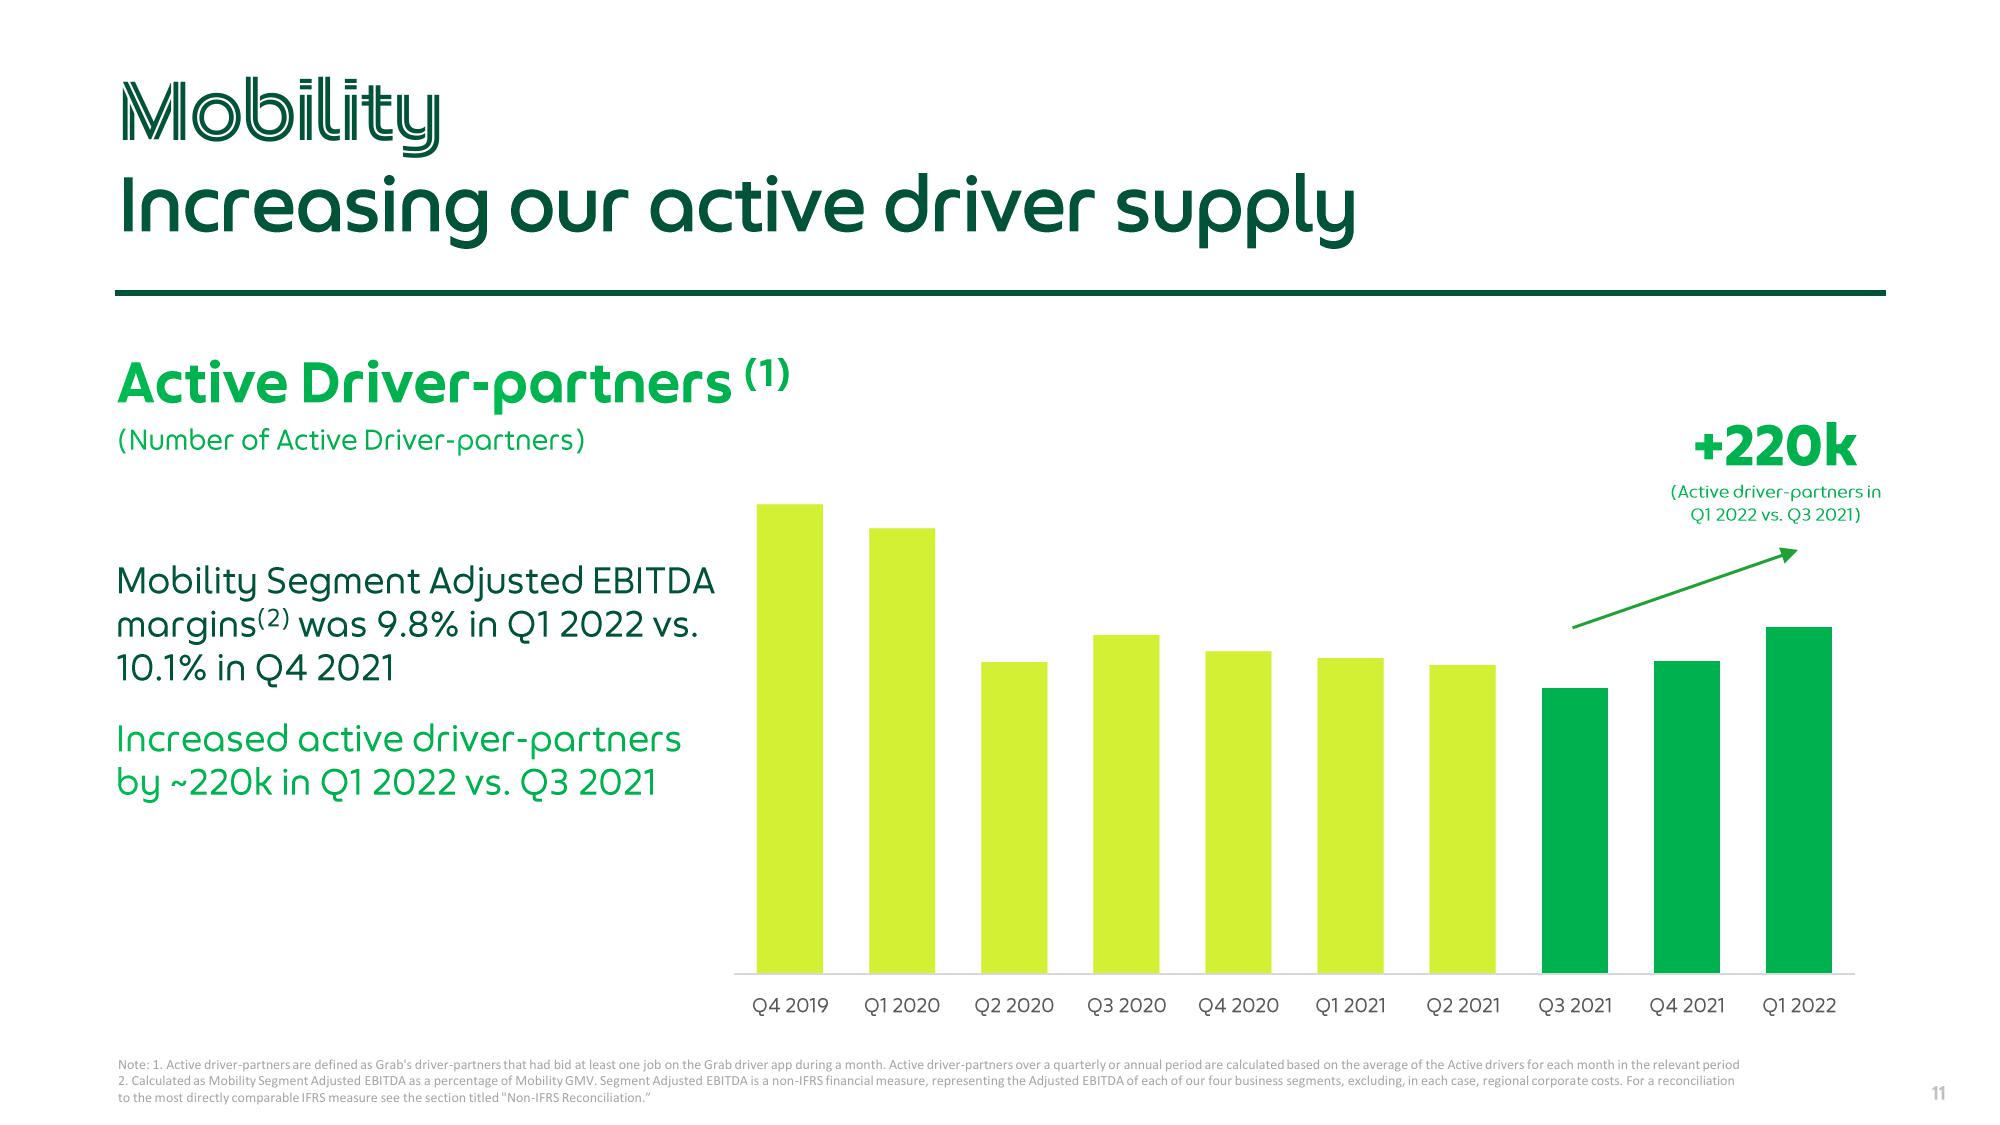
Active Driver-partners (1)
(Number of Active Driver-partners)
Mobility Segment Adjusted EBITDA
margins (2) was 9.8% in Q1 2022 vs.
10.1% in Q4 2021
Increased active driver-partners
by ~220k in Q1 2022 vs. Q3 2021
Q4 2019 Q1 2020 Q2 2020
Q3 2020
Q4 2020
Q1 2021
Q2 2021
Q3 2021
+220k
(Active driver-partners in
Q1 2022 vs. Q3 2021)
Q4 2021
Note: 1. Active driver-partners are defined as Grab's driver-partners that had bid at least one job on the Grab driver app during a month. Active driver-partners over a quarterly or annual period are calculated based on the average of the Active drivers for each month in the relevant period
2. Calculated as Mobility Segment Adjusted EBITDA as a percentage of Mobility GMV. Segment Adjusted EBITDA is a non-IFRS financial measure, representing the Adjusted EBITDA of each of our four business segments, excluding, in each case, regional corporate costs. For a reconciliation
to the most directly comparable IFRS measure see the section titled "Non-IFRS Reconciliation."
Q1 2022
11View entire presentation