Kering Investor Presentation Deck
AIR
EMISSIONS
GHGS
LAND USE
ÇA
WASTE
WATER
CONSUMPTION
WATER
POLLUTION
a
TOTAL IN
MILLIONS
End of life
0,2%
€0,9
THE EP&L, CORNERSTONE OF OUR ENVIRONMENTAL APPROACH
Use phase
12%
€61,3
TIER 0
Stores,
warehouses,
offices
10%
€52,5
TIER 1
Assembly
5%
€28,0
TIER 2
Manufacturing
8%
€43,5
TIER 3
Raw material
processing
9%
€44,0
TIER 4
Raw material
production
56%
€285,7
TOTAL IN
MILLIONS
10%
€50,2
35%
€ 183,7
31%
€160,3
7%
€34,2
7%
€33,8
10%
€53,7
100%
€515,9
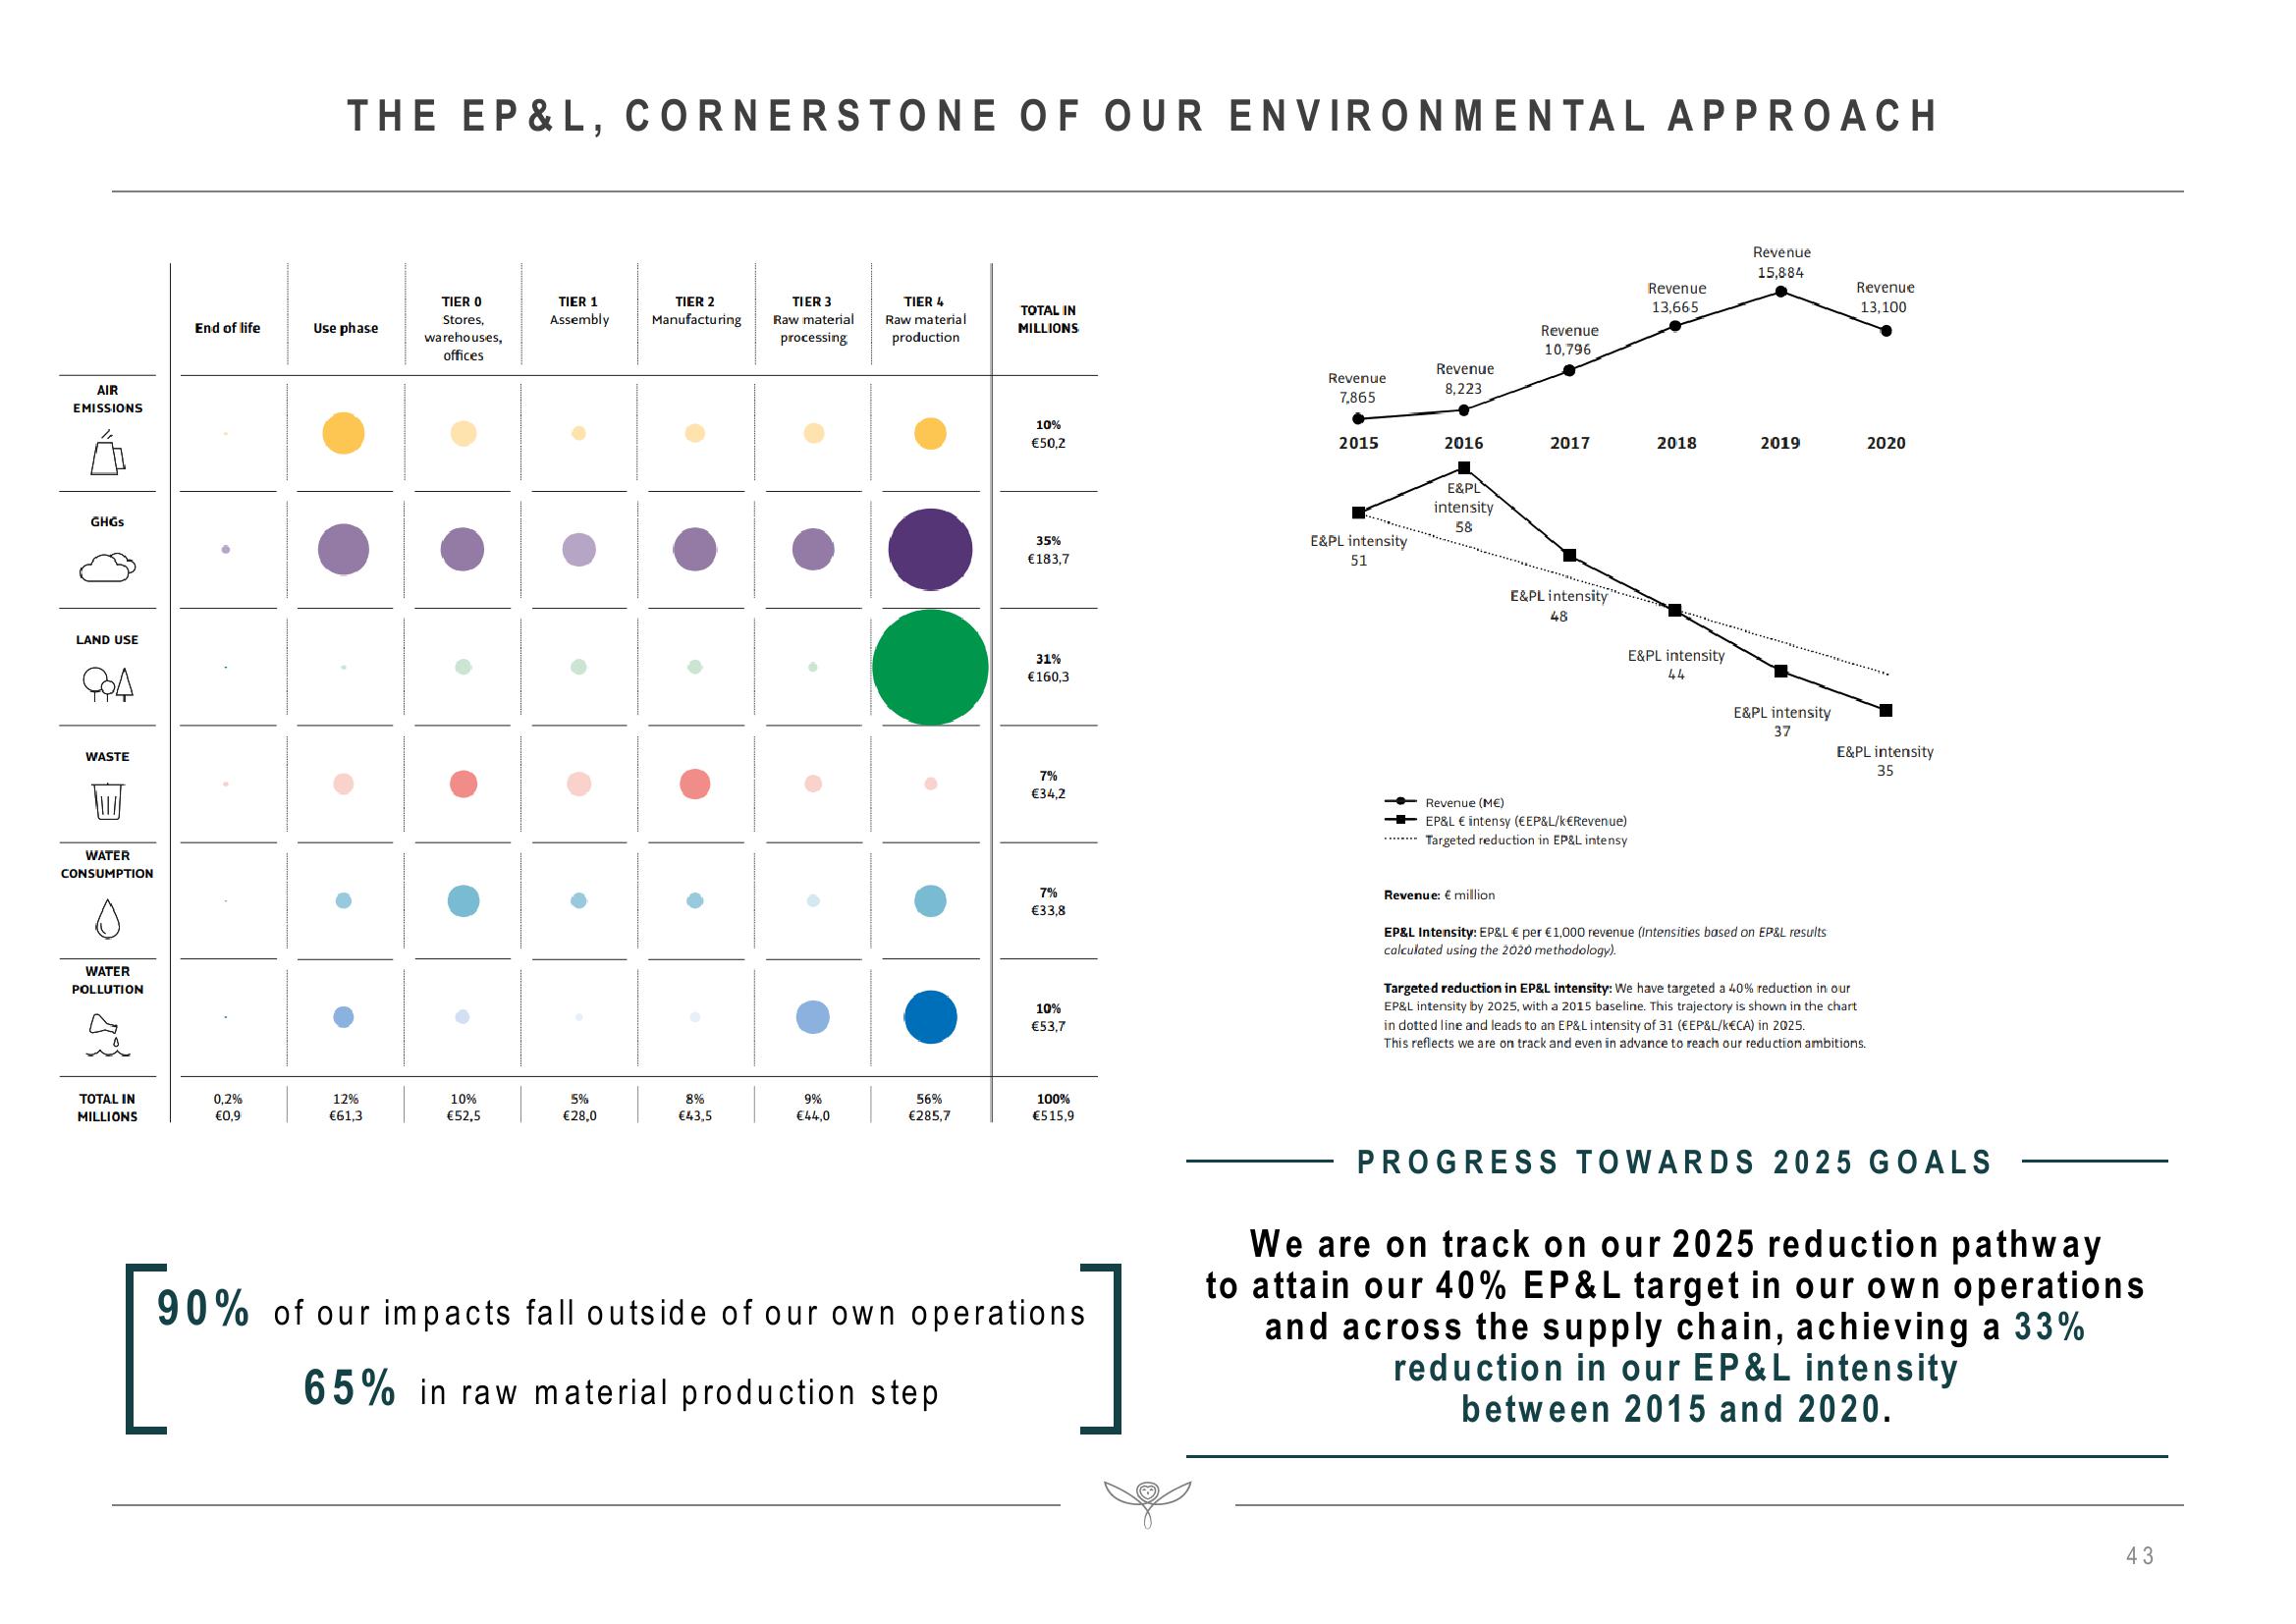
90% of our impacts fall outside of our own operations
65% in raw material production step
Revenue
7,865
2015
E&PL intensity
51
Revenue
8,223
2016
E&PL
intensity
58
Revenue
10,796
Revenue: € million
2017
E&PL intensity
48
Revenue (M€)
EP&L € intensy (EEP&L/k€Revenue)
******** Targeted reduction in EP&L intensy
Revenue
13,665
2018
E&PL intensity
44
Revenue
15,884
2019
E&PL intensity
37
EP&L Intensity: EP&L € per €1,000 revenue (Intensities based on EP&L results
calculated using the 2020 methodology).
Revenue
13,100
2020
E&PL intensity
35
Targeted reduction in EP&L intensity: We have targeted a 40% reduction in our
EP&L intensity by 2025, with a 2015 baseline. This trajectory is shown in the chart
in dotted line and leads to an EP&L intensity of 31 (EEP&L/KECA) in 2025.
This reflects we are on track and even in advance to reach our reduction ambitions.
PROGRESS TOWARDS 2025 GOALS
We are on track on our 2025 reduction pathway
to attain our 40% EP&L target in our own operations
and across the supply chain, achieving a 33%
reduction in our EP&L intensity
between 2015 and 2020.
43View entire presentation