Plastiq SPAC Presentation Deck
IQ
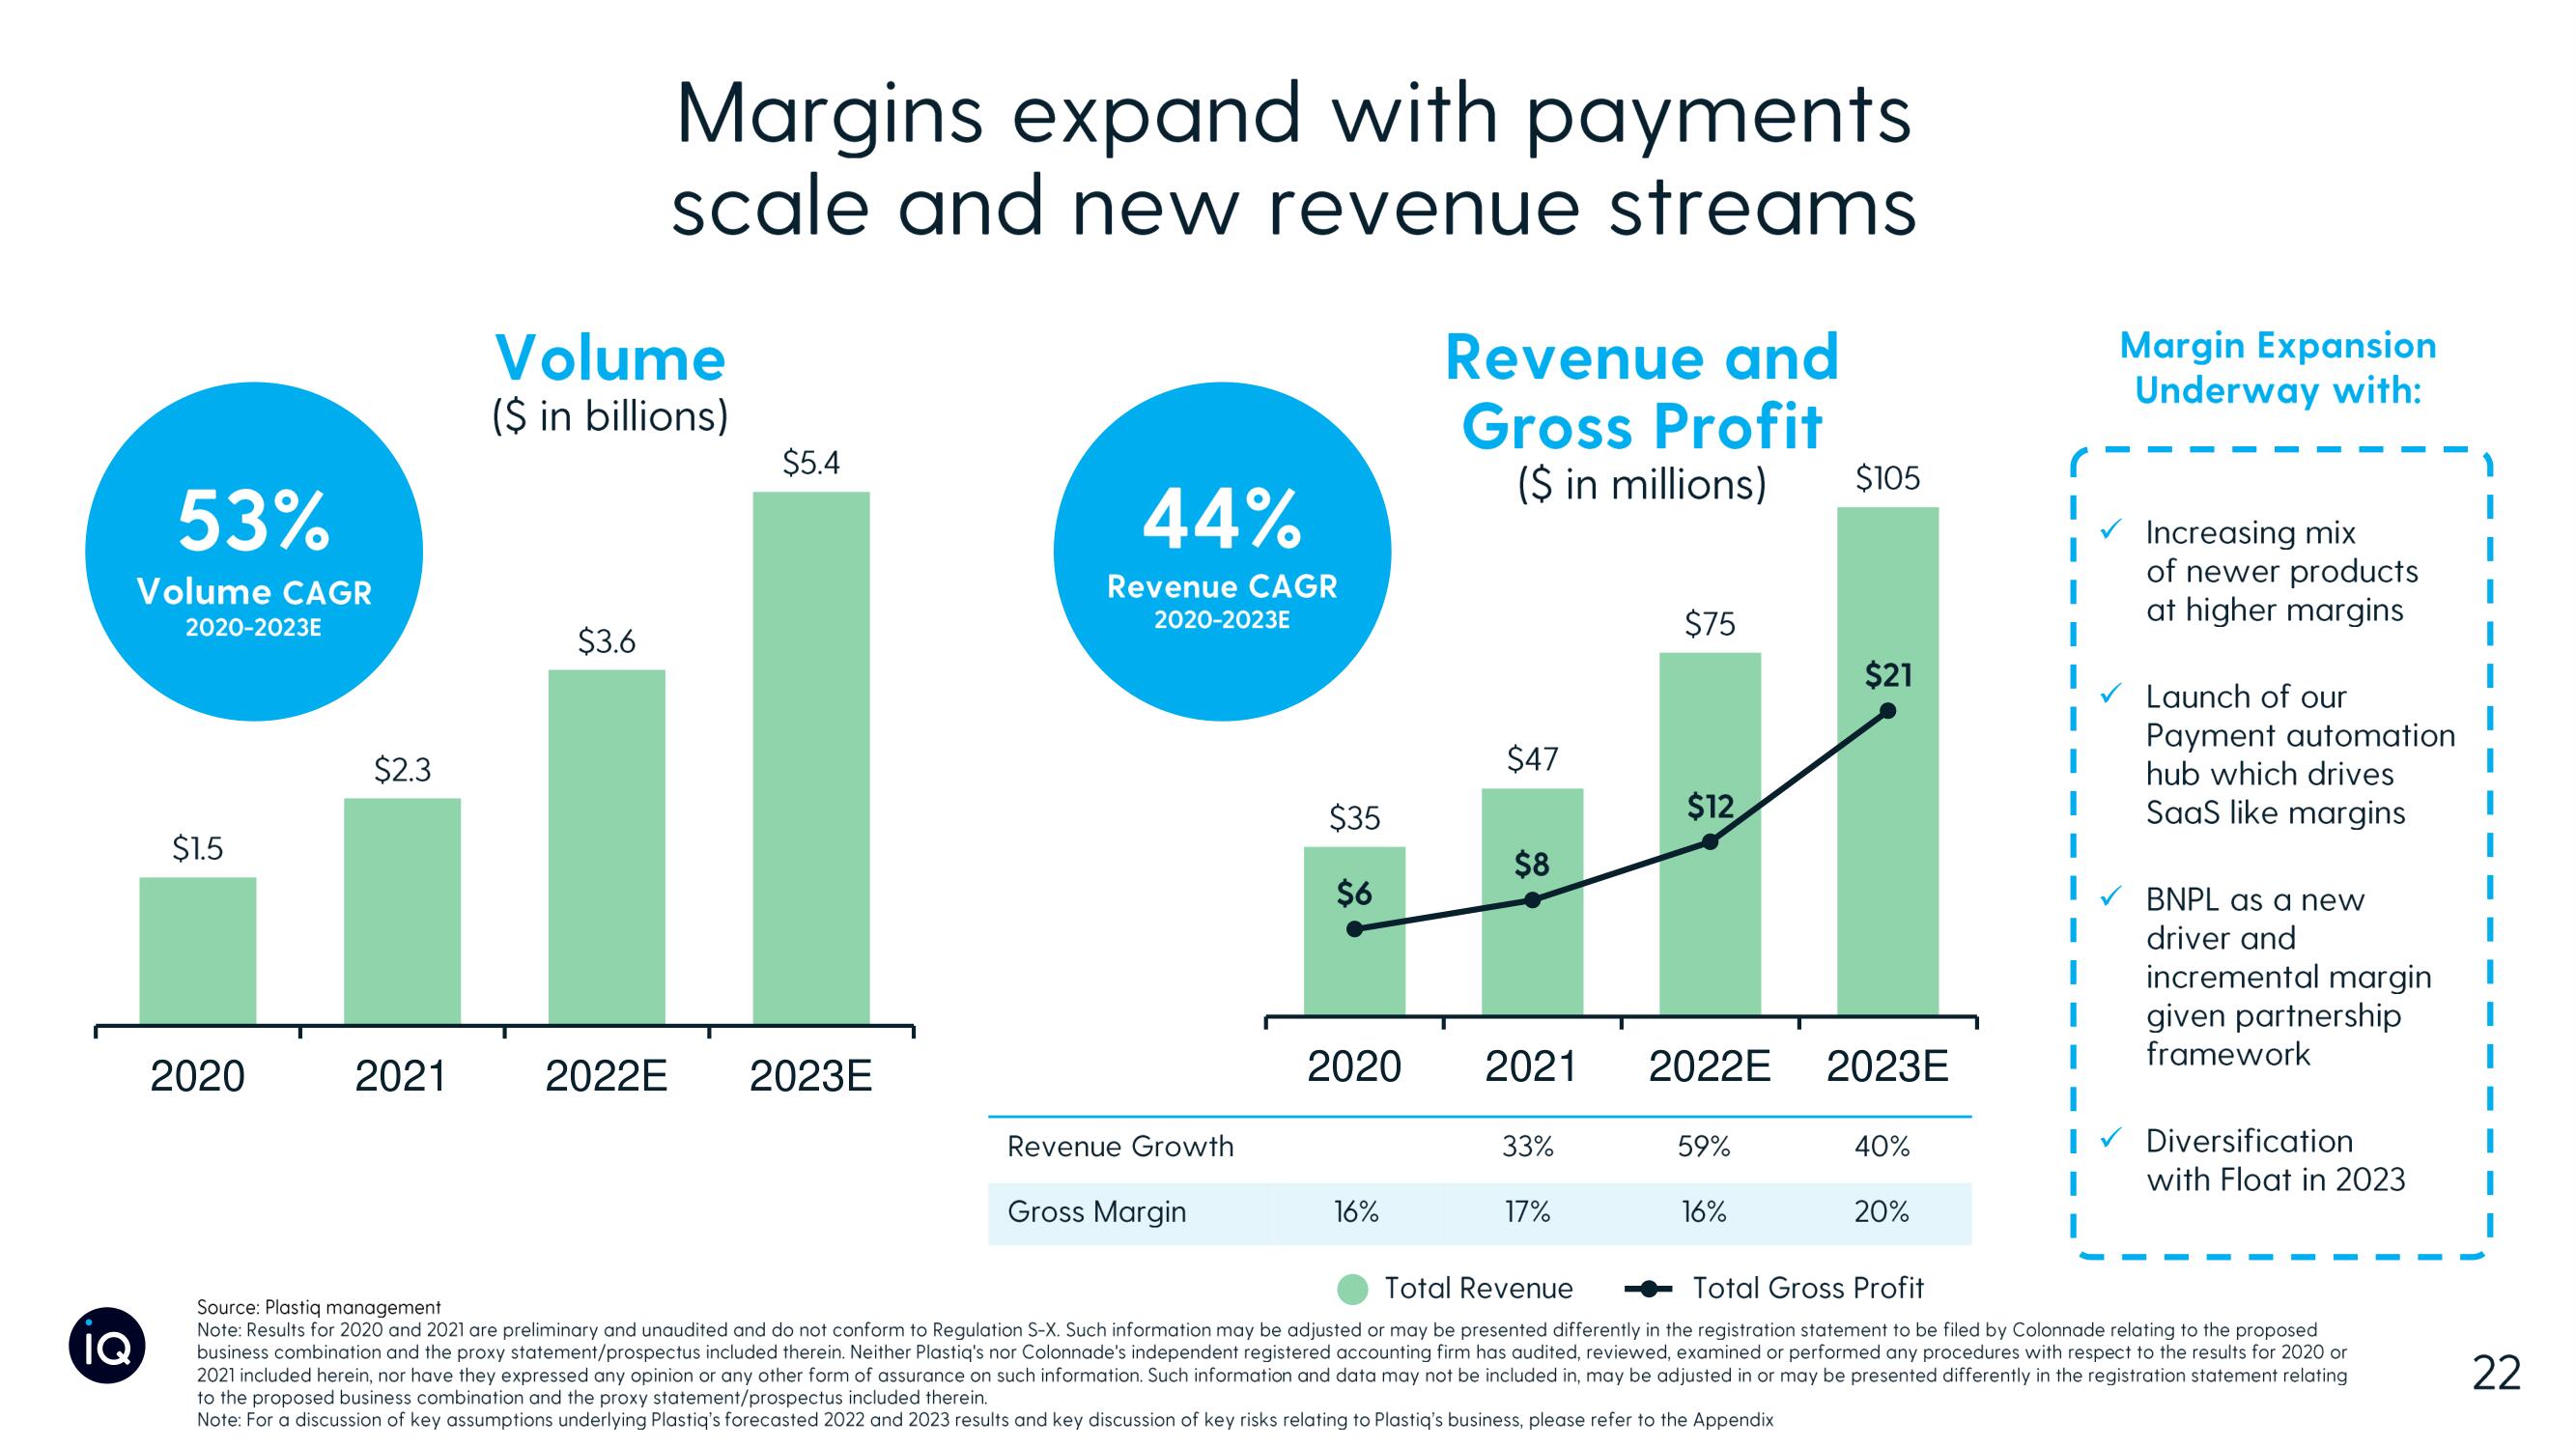
53%
Volume CAGR
2020-2023E
$1.5
2020
$2.3
2021
Volume
($ in billions)
$3.6
Margins expand with payments
scale and new revenue streams
2022E
$5.4
2023E
44%
Revenue CAGR
2020-2023E
Revenue Growth
Gross Margin
$35
$6
2020
16%
Revenue and
Gross Profit
($ in millions)
$47
$8
33%
$75
17%
$12
2021 2022E 2023E
59%
$105
16%
$21
40%
20%
Margin Expansion
Underway with:
✓ Increasing mix
of newer products
at higher margins
Launch of our
Payment automation
hub which drives
SaaS like margins
BNPL as a new
driver and
incremental margin
given partnership
framework
Diversification
with Float in 2023
Total Revenue
Total Gross Profit
Source: Plastiq management
Note: Results for 2020 and 2021 are preliminary and unaudited and do not conform to Regulation S-X. Such information may be adjusted or may be presented differently in the registration statement to be filed by Colonnade relating to the proposed
business combination and the proxy statement/prospectus included therein. Neither Plastiq's nor Colonnade's independent registered accounting firm has audited, reviewed, examined or performed any procedures with respect to the results for 2020 or
2021 included herein, nor have they expressed any opinion or any other form of assurance on such information. Such information and data may not be included in, may be adjusted in or may be presented differently in the registration statement relating
to the proposed business combination and the proxy statement/prospectus included therein.
Note: For a discussion of key assumptions underlying Plastiq's forecasted 2022 and 2023 results and key discussion of key risks relating to Plastiq's business, please refer to the Appendix
22View entire presentation