OSP Value Fund IV LP Q4 2022
OSP
P&L
1998
1999
2000
2001
2002
2003
2004
2005
2006
2007
2008
2009
2010
2011
2012
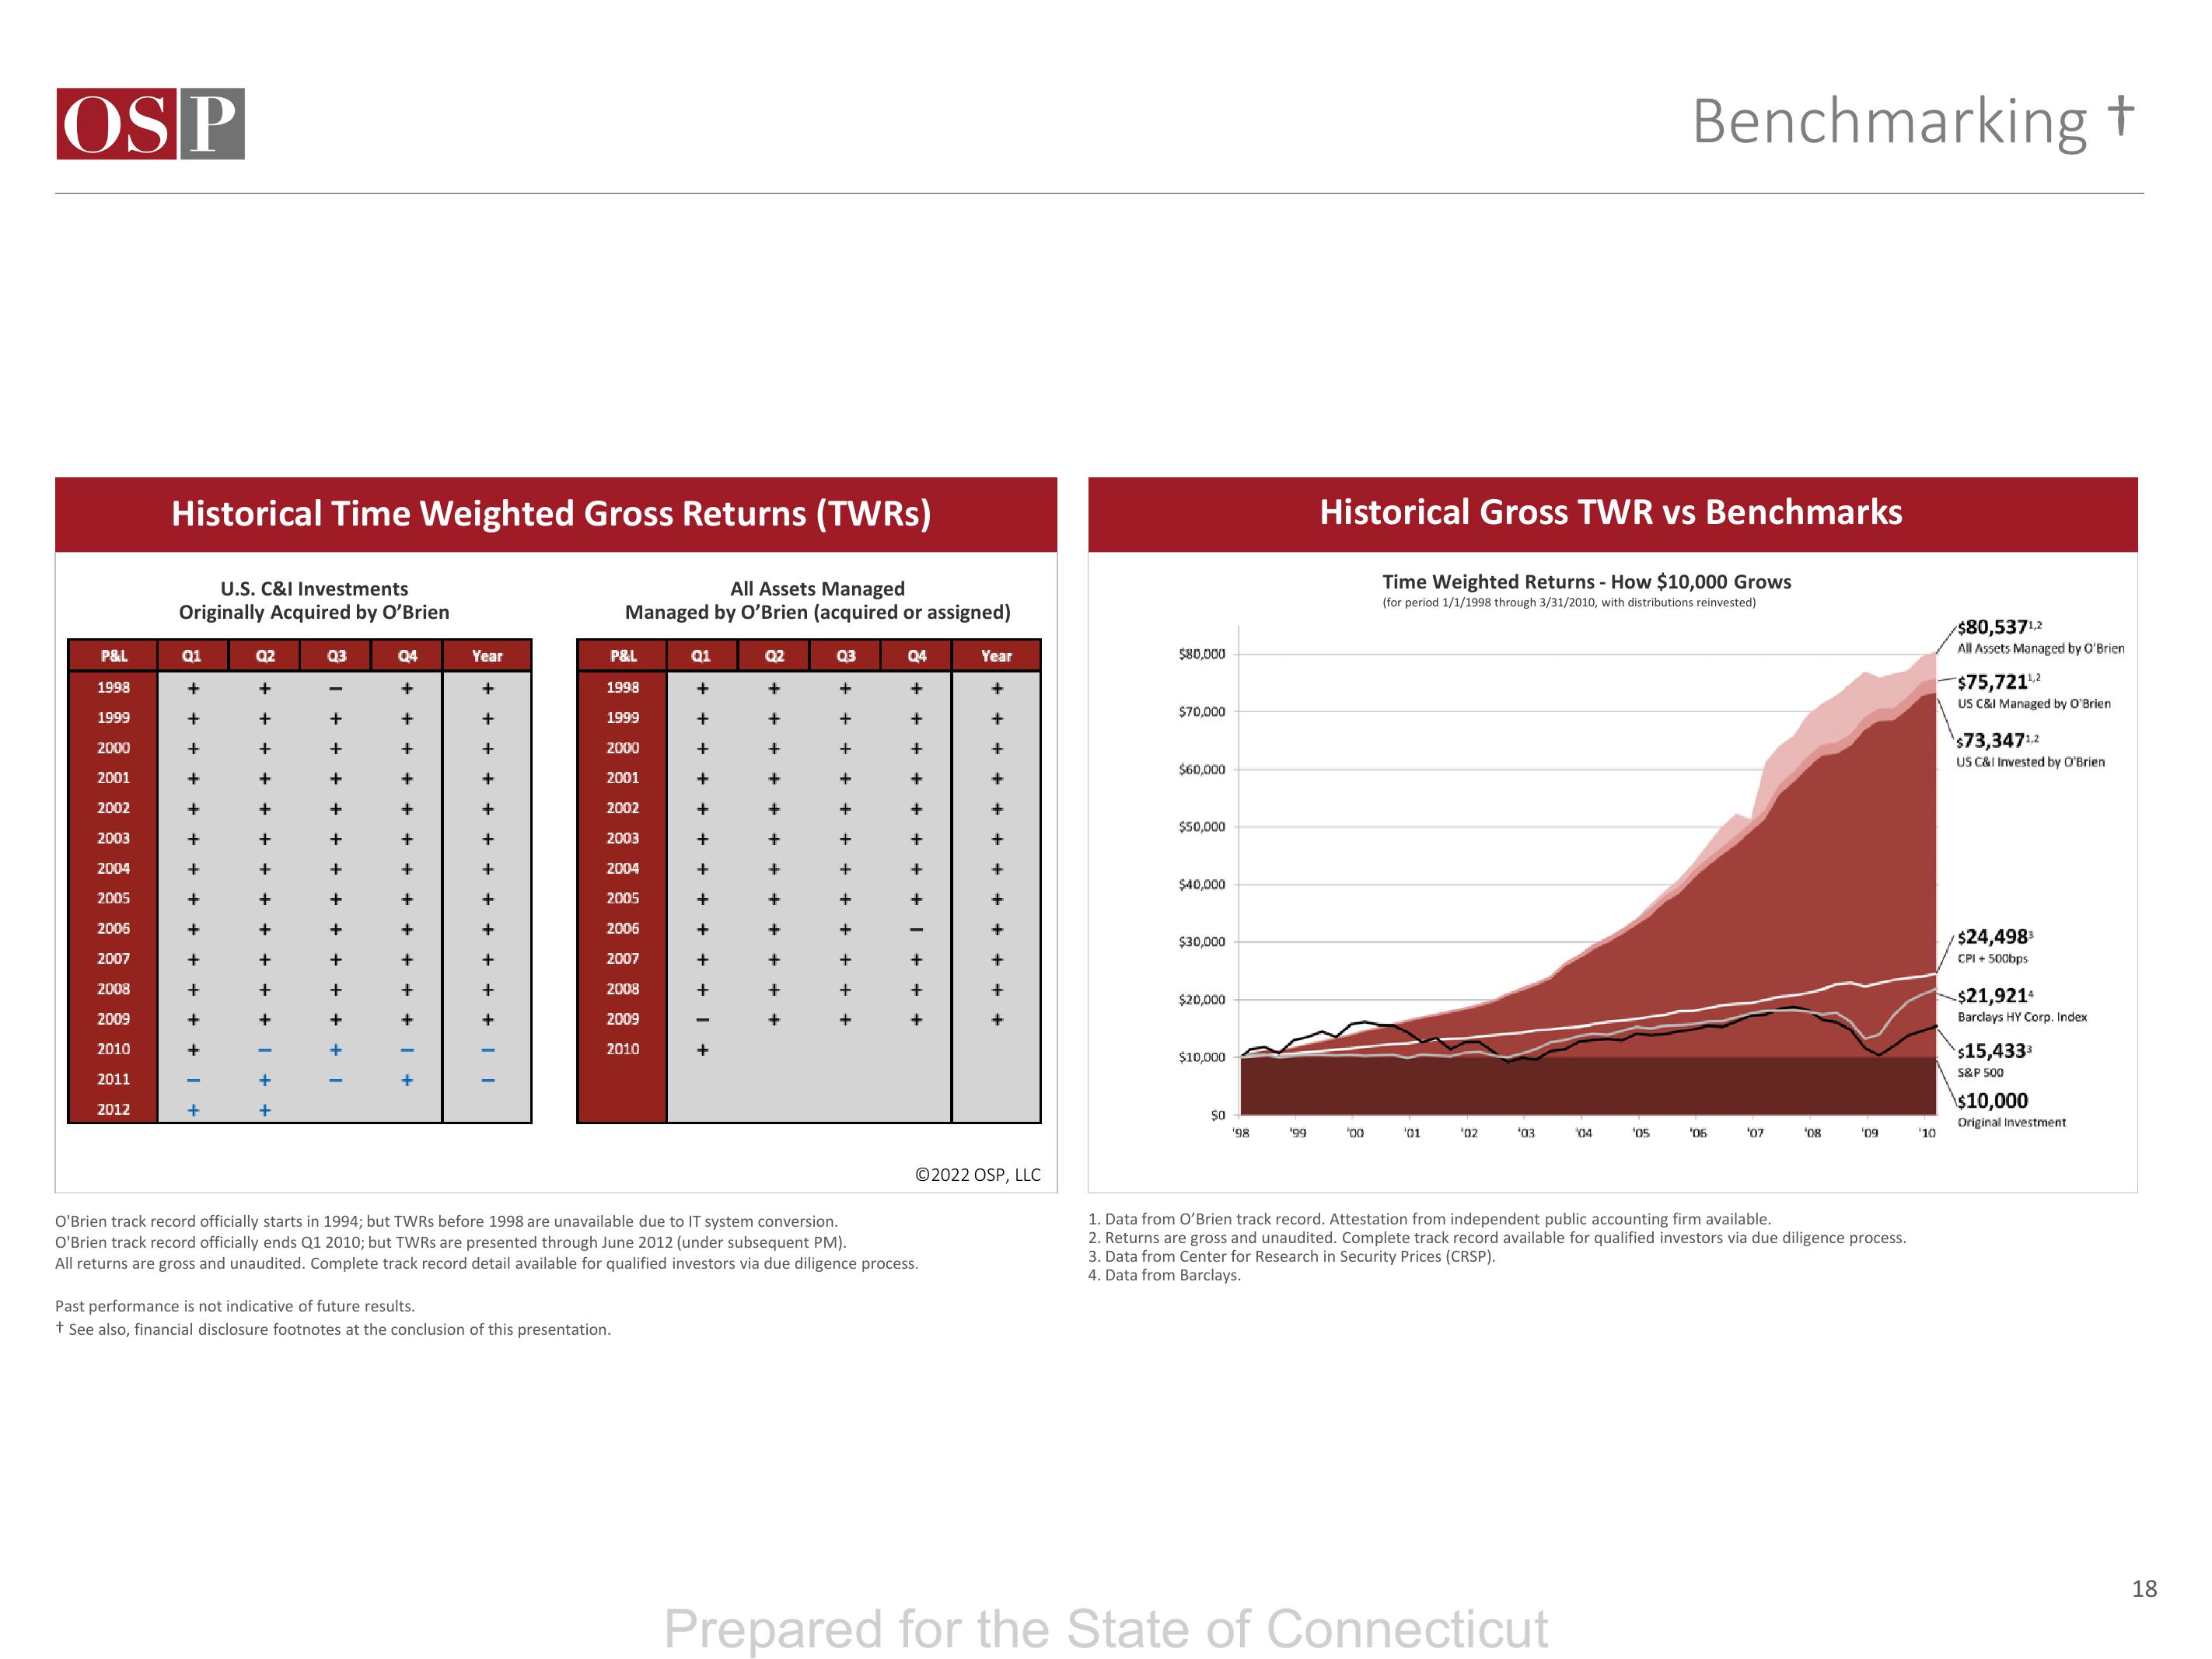
Historical Time Weighted Gross Returns (TWRs)
U.S. C&I Investments
Originally Acquired by O'Brien
Q1
+
+
+
+
+
+
+
+
+
+
+
+
+
Q2
+
+
+
+
+
+
+
+
+
+
+
+
03
+
+
+
+
+
+
+
+
+
+
+
+
Q4
+
+
+
+
+
+
+
+
+
+
+
+
Year
+
+
All Assets Managed
Managed by O'Brien (acquired or assigned)
P&L
1998
1999
2000
2001
2002
2003
2004
2005
2006
2007
2008
2009
2010
Past performance is not indicative of future results.
+ See also, financial disclosure footnotes at the conclusion of this presentation.
Q1
+
+
+
+
+
+
+
+
+
+
+
+
Q2
+
+
+
+
+
+
+
+
+
Q3
+
+
+
+
+
+
+
+
Q4
+
+
+
O'Brien track record officially starts in 1994; but TWRs before 1998 are unavailable due to IT system conversion.
O'Brien track record officially ends Q1 2010; but TWRs are presented through June 2012 (under subsequent PM).
All returns are gross and unaudited. Complete track record detail available for qualified investors via due diligence process.
Year
+
+
Ⓒ2022 OSP, LLC
$80,000
$70,000
$60,000
$50,000
$40,000
$30,000
$20,000
$10,000
$0
'98
'99
Historical Gross TWR vs Benchmarks
'00
Time Weighted Returns - How $10,000 Grows
(for period 1/1/1998 through 3/31/2010, with distributions reinvested)
'01
¹02
'03
Benchmarking t
'04
Prepared for the State of Connecticut
'05
'06
'07
'08
'09
1. Data from O'Brien track record. Attestation from independent public accounting firm available.
2. Returns are gross and unaudited. Complete track record available for qualified investors via due diligence process.
3. Data from Center for Research in Security Prices (CRSP).
4. Data from Barclays.
'10
$80,5371,2
All Assets Managed by O'Brien
$75,721¹,2
US C&I Managed by O'Brien
$73,3471,2
US C&I Invested by O'Brien
$24,498³
CPI + 500bps
-$21,9214
Barclays HY Corp. Index
$15,433¹
S&P 500
$10,000
Original Investment
18View entire presentation