Playboy SPAC Presentation Deck
PLAYBOY 2020
34
Comparable Company Benchmarking (1/3)
EV / 2021E
Adjusted EBITDA
2019A-2021E
Adjusted Revenue
CAGR
2019A-2021E
Adjusted EBITDA
CAGR
Adjusted EBITDA
Margin
10.3x
Playboy
46.0%
Playboy
85.4%
Playboy
24.1% ¹
Playboy
19.5x
Sexual Wellness
3.6%
Sexual Wellness
1.9%
Sexual Wellness
25.3%
Sexual Wellness
10.4x
Fashion Apparel & Accessoires Digital and Experiences
(4.0%)
Fashion Apparel & Accessoires
12.3%
13.6x
Fashion Apparel & Accessoires
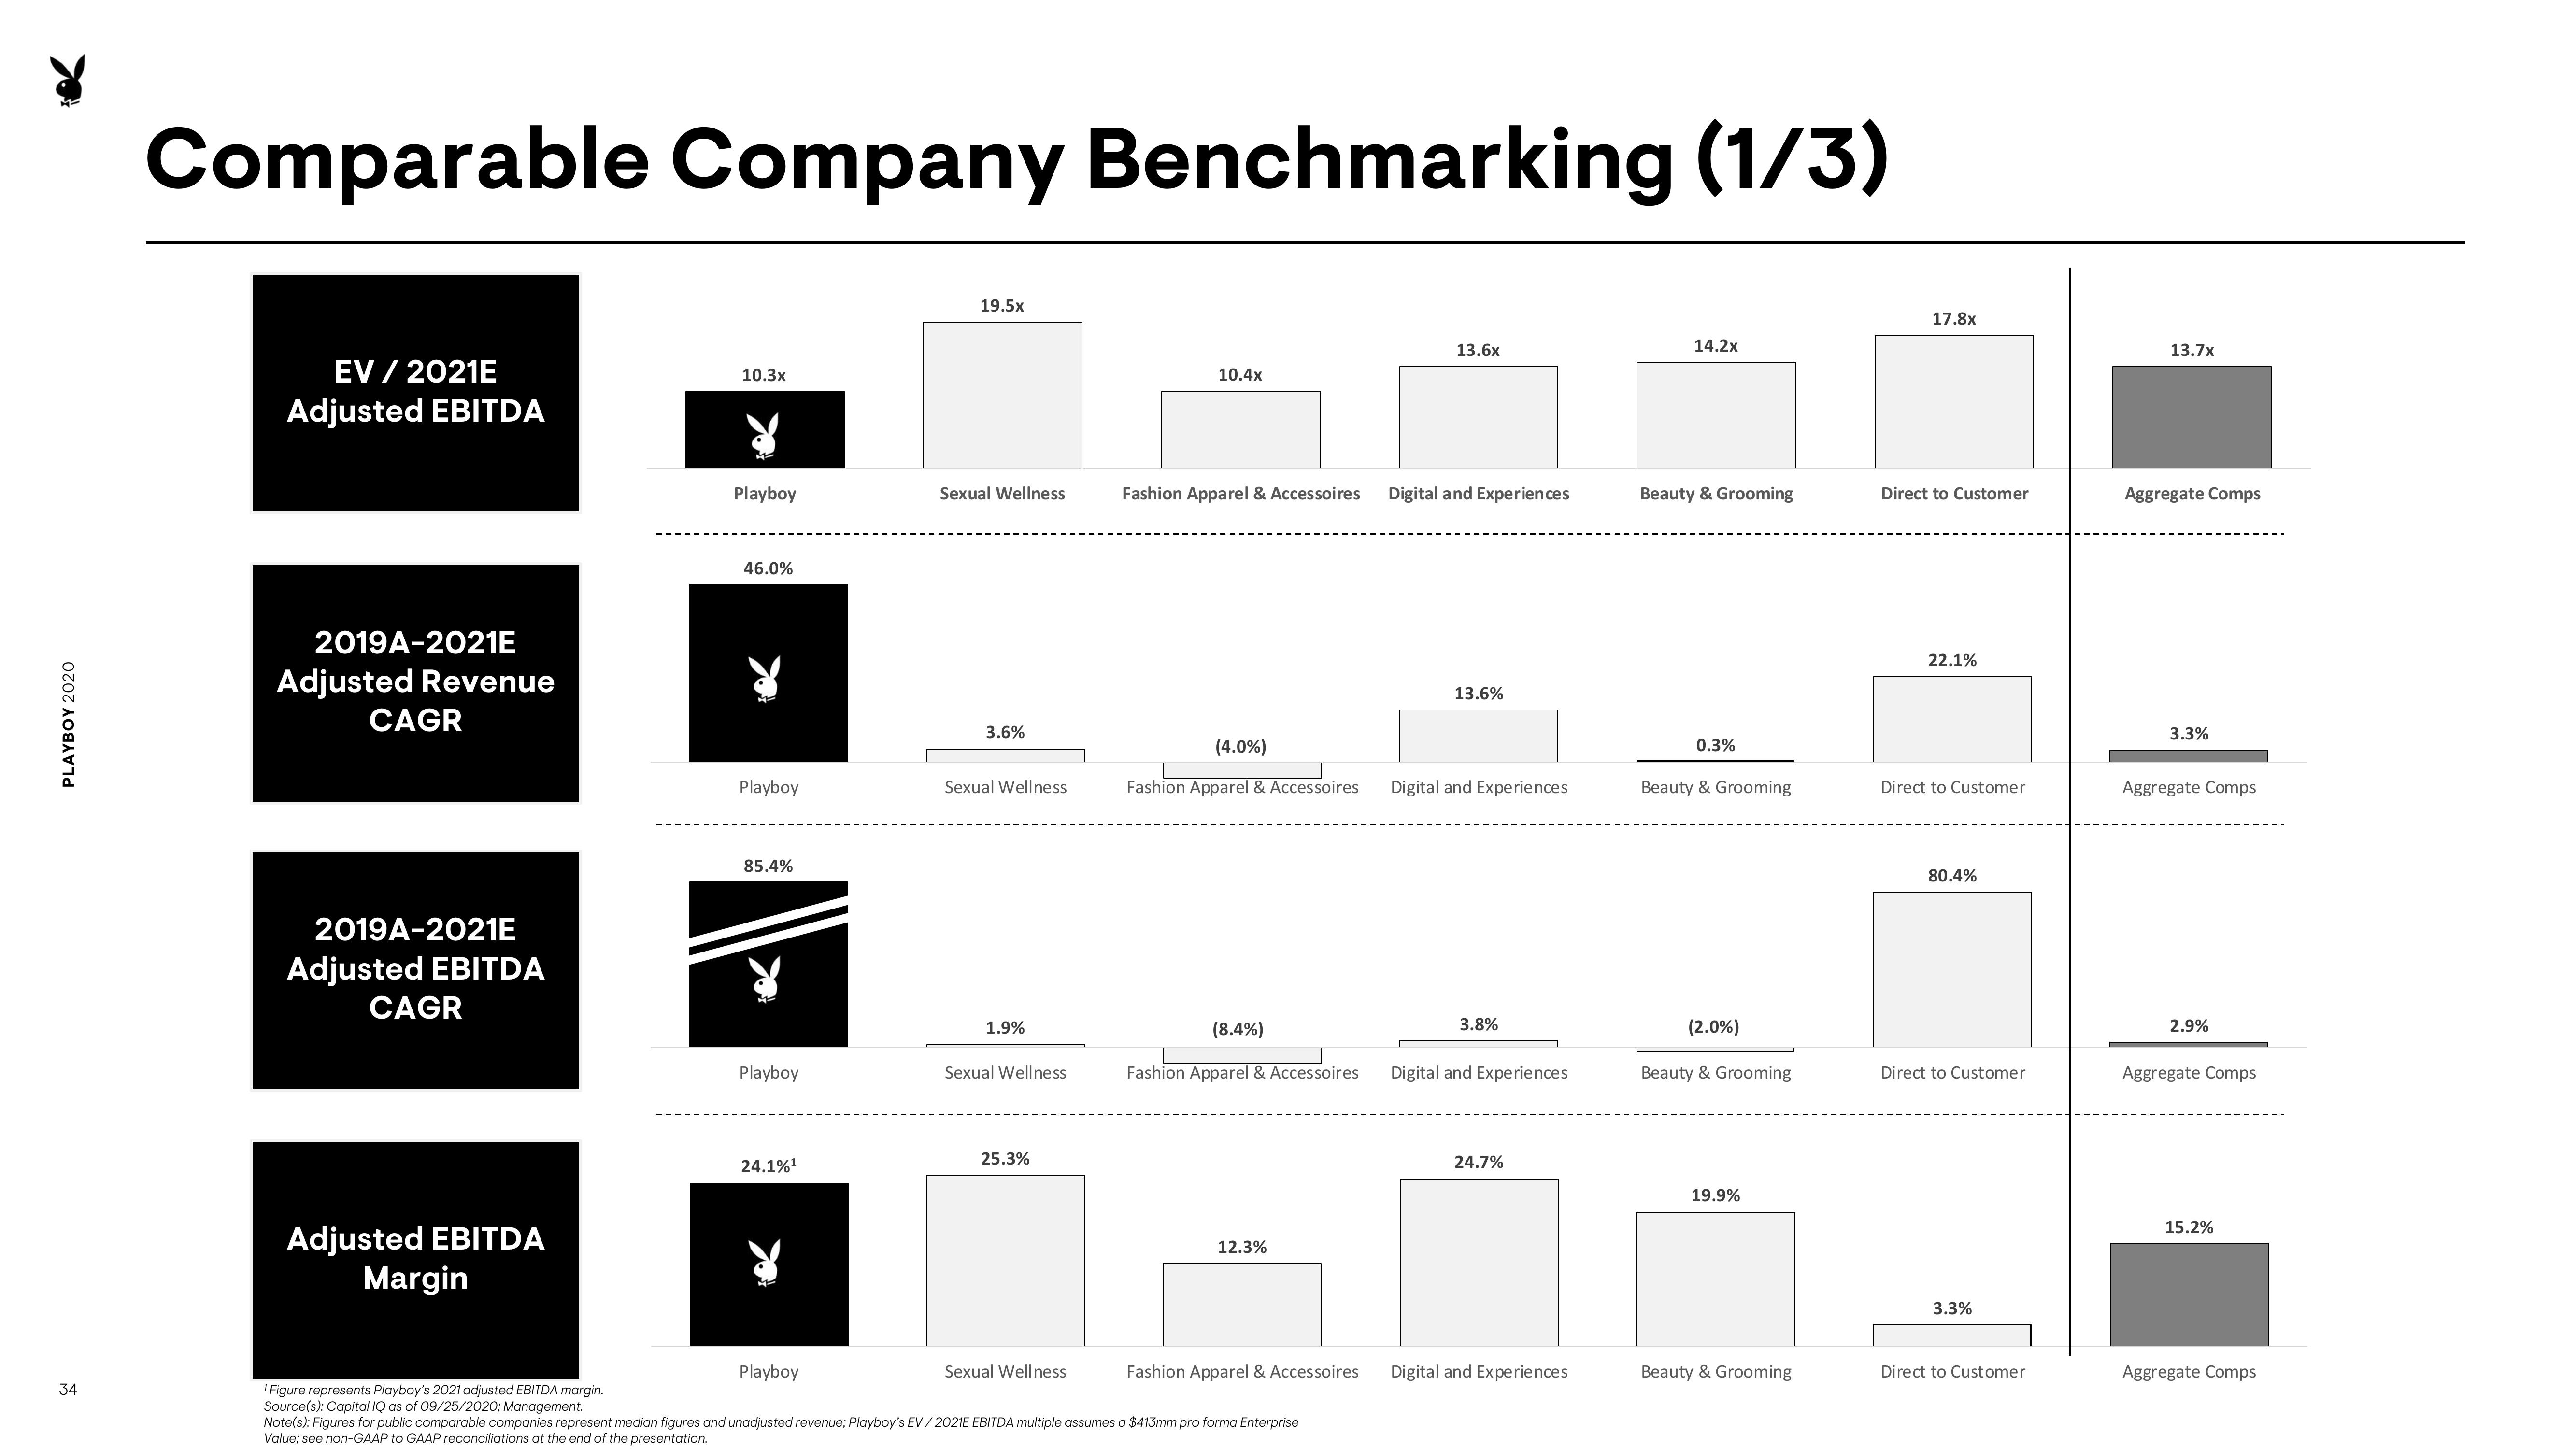
¹ Figure represents Playboy's 2021 adjusted EBITDA margin.
Source(s): Capital IQ as of 09/25/2020; Management.
Note(s): Figures for public comparable companies represent median figures and unadjusted revenue; Playboy's EV/2021E EBITDA multiple assumes a $413mm pro forma Enterprise
Value; see non-GAAP to GAAP reconciliations at the end of the presentation.
13.6%
(8.4%)
Fashion Apparel & Accessoires Digital and Experiences
Digital and Experiences
3.8%
24.7%
Digital and Experiences.
14.2x
Beauty & Grooming
0.3%
Beauty & Grooming
(2.0%)
Beauty & Grooming
19.9%
Beauty & Grooming
17.8x
Direct to Customer
22.1%
Direct to Customer
80.4%
Direct to Customer
3.3%
Direct to Customer
13.7x
Aggregate Comps
3.3%
Aggregate Comps
2.9%
Aggregate Comps
15.2%
Aggregate CompsView entire presentation