Sonos Results Presentation Deck
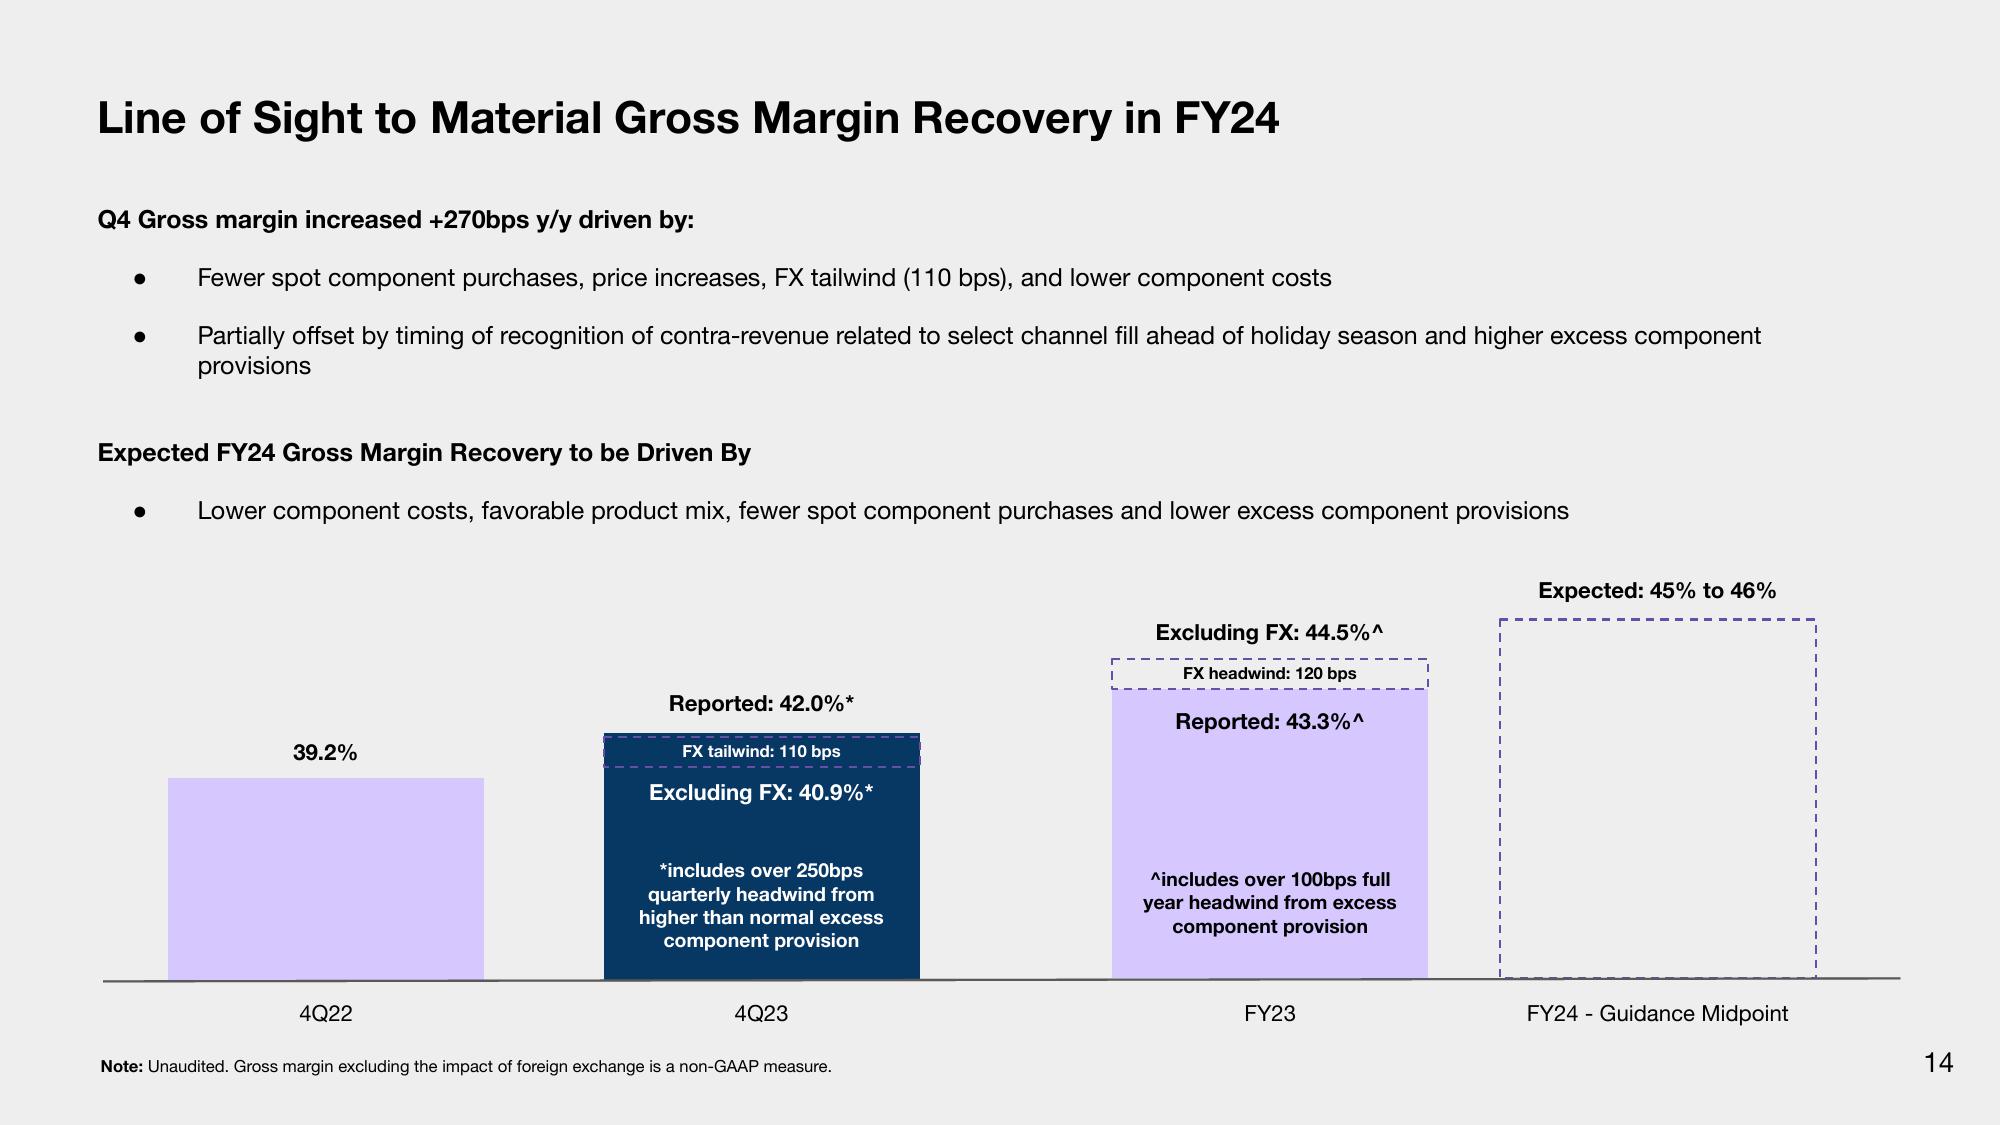
Line of Sight to Material Gross Margin Recovery in FY24
Q4 Gross margin increased +270bps y/y driven by:
Fewer spot component purchases, price increases, FX tailwind (110 bps), and lower component costs
Partially offset by timing of recognition of contra-revenue related to select channel fill ahead of holiday season and higher excess component
provisions
●
Expected FY24 Gross Margin Recovery to be Driven By
● Lower component costs, favorable product mix, fewer spot component purchases and lower excess component provisions
39.2%
4Q22
Reported: 42.0%*
FX tailwind: 110 bps
Excluding FX: 40.9%*
*includes over 250bps
quarterly headwind from
higher than normal excess
component provision
4Q23
Note: Unaudited. Gross margin excluding the impact of foreign exchange is a non-GAAP measure.
I
Excluding FX: 44.5%^
FX headwind: 120 bps
Reported: 43.3%^
^includes over 100bps full
year headwind from excess
component provision
FY23
Expected: 45% to 46%
FY24 - Guidance Midpoint
14View entire presentation