Fiscal First Quarter 2024 Financial Results
Fiscal First Quarter 2024 Results and Other Highlights
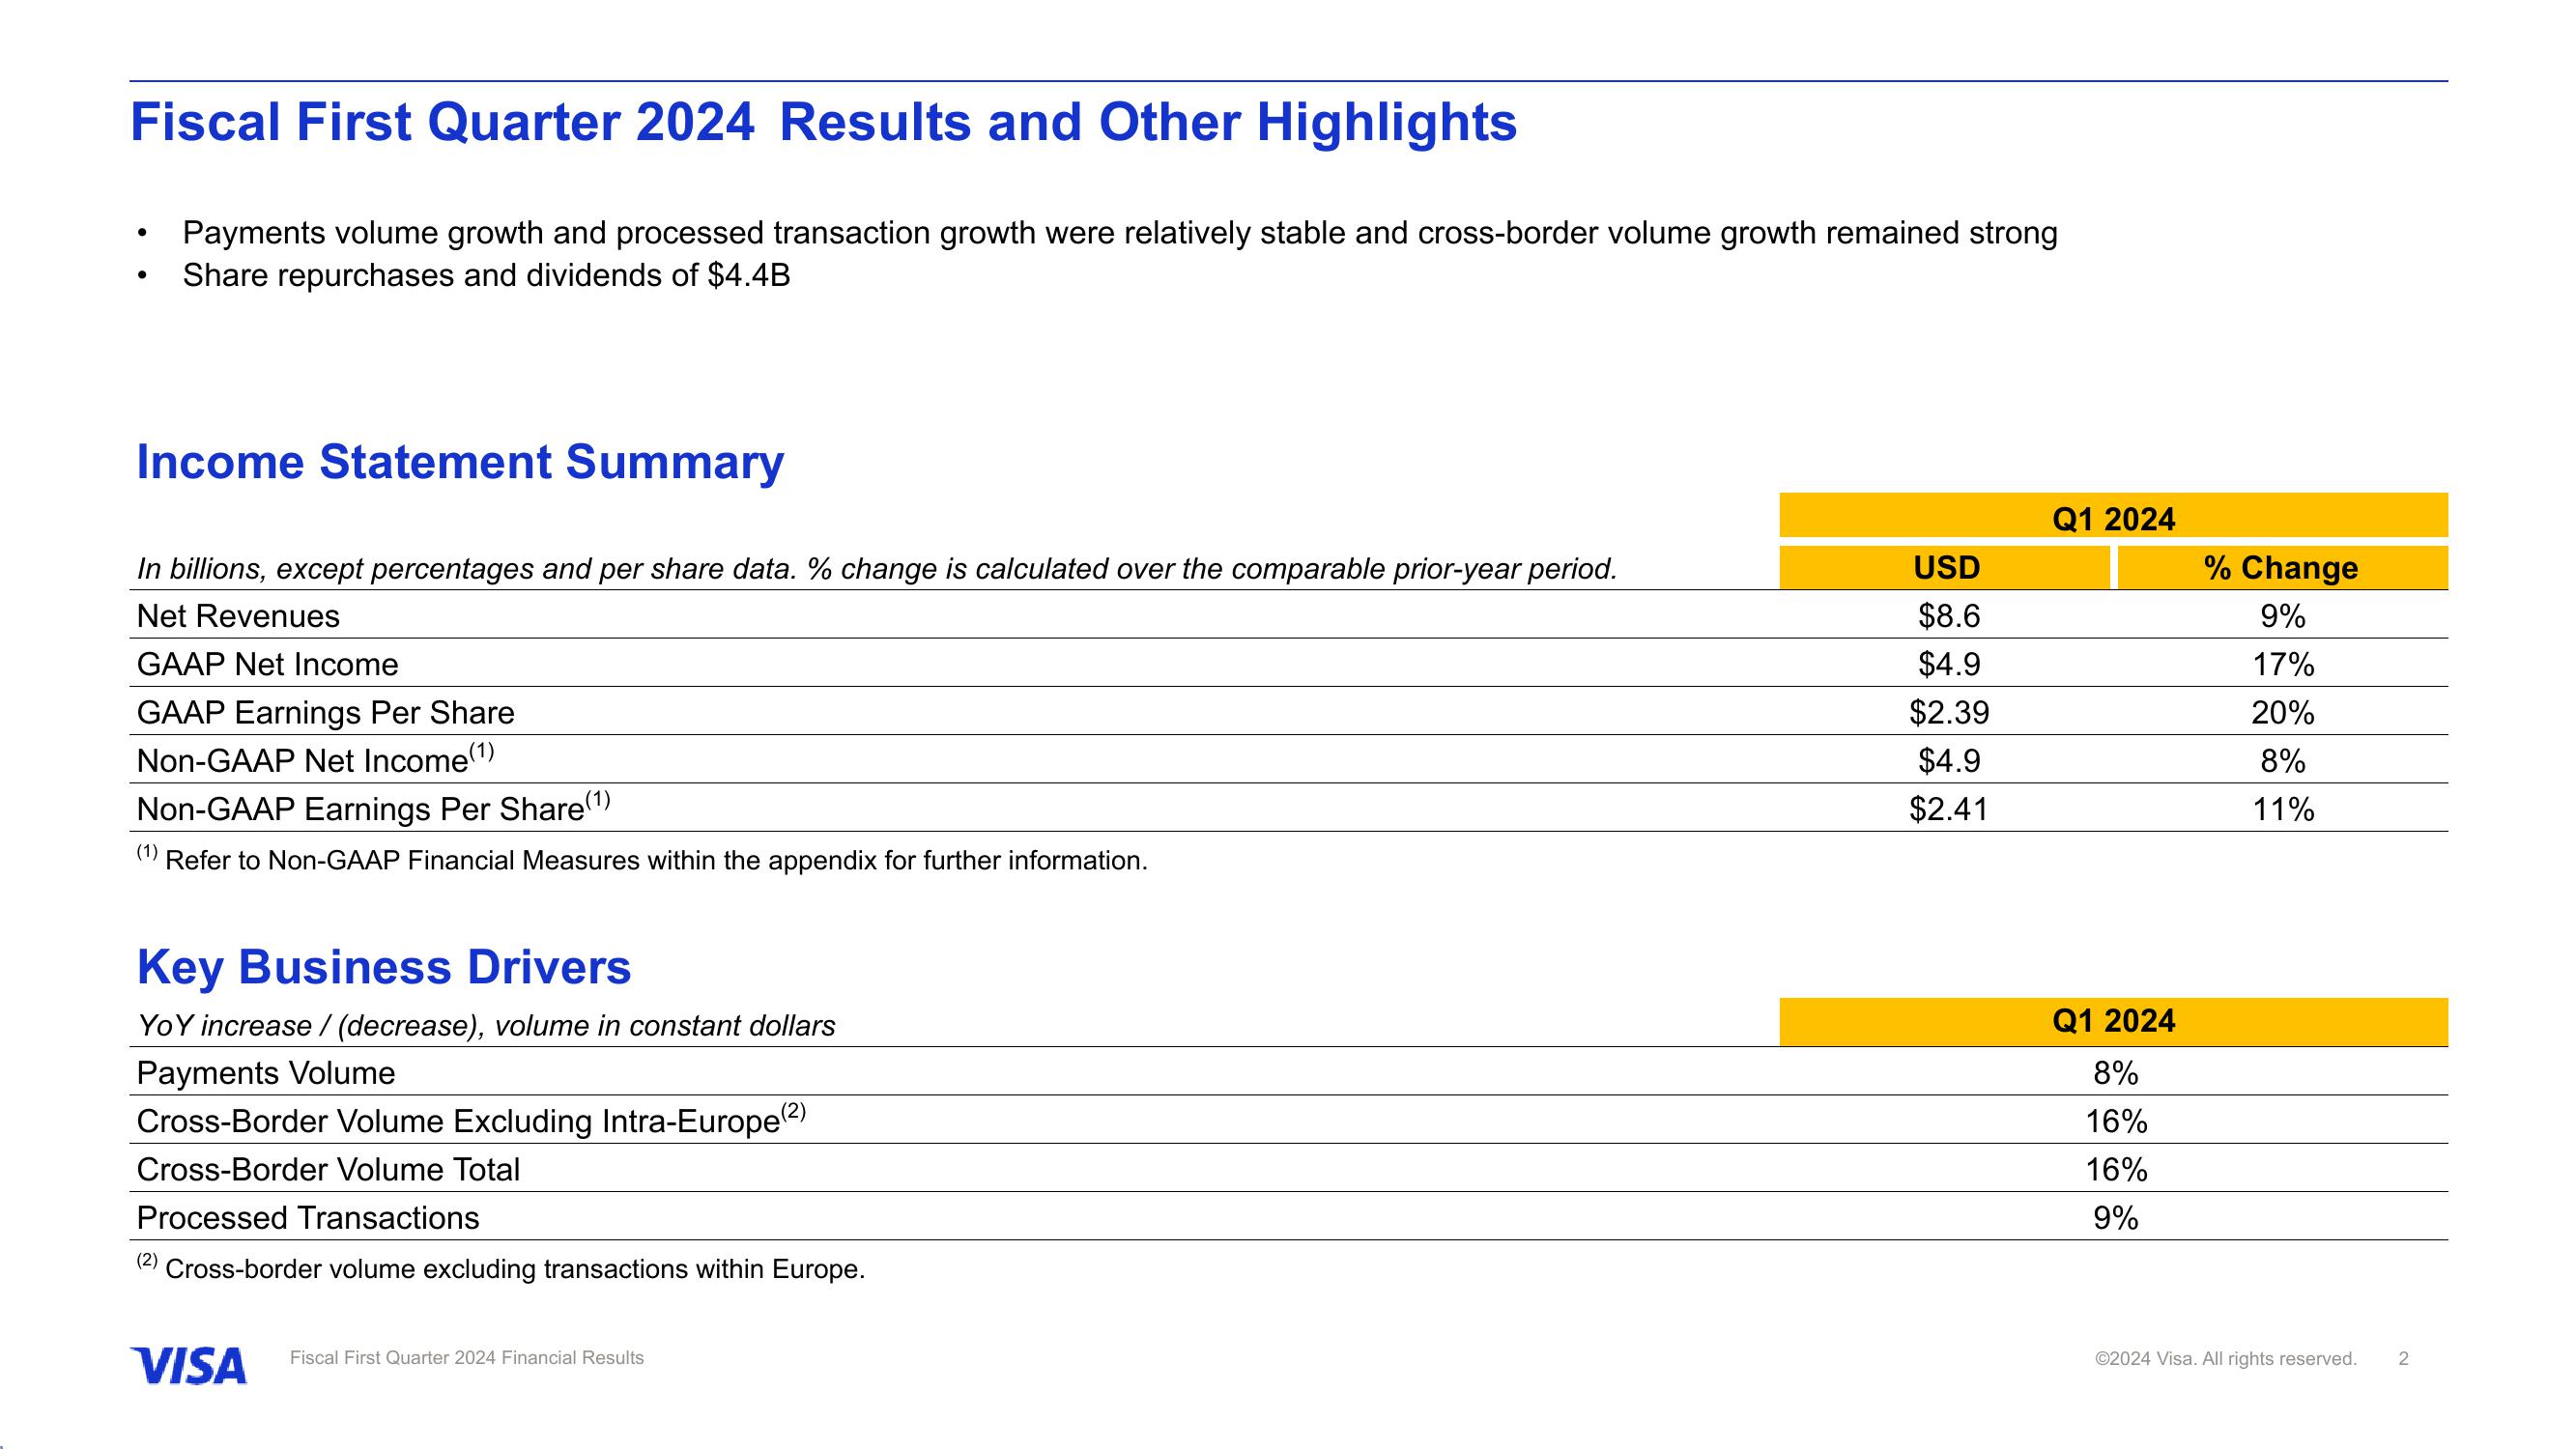
Payments volume growth and processed transaction growth were relatively stable and cross-border volume growth remained strong
Share repurchases and dividends of $4.4B
●
Income Statement Summary
In billions, except percentages and per share data. % change is calculated over the comparable prior-year period.
Net Revenues
GAAP Net Income
GAAP Earnings Per Share
Non-GAAP Net Income(¹)
Non-GAAP Earnings Per Share(¹)
(1) Refer to Non-GAAP Financial Measures within the appendix for further information.
Key Business Drivers
YoY increase / (decrease), volume in constant dollars
Payments Volume
Cross-Border Volume Excluding Intra-Europe (²)
Cross-Border Volume Total
Processed Transactions
(2) Cross-border volume excluding transactions within Europe.
VISA
Fiscal First Quarter 2024 Financial Results
USD
$8.6
$4.9
$2.39
$4.9
$2.41
Q1 2024
Q1 2024
8%
16%
16%
9%
% Change
9%
17%
20%
8%
11%
Ⓒ2024 Visa. All rights reserved.
2View entire presentation