Adtheorent SPAC Presentation Deck
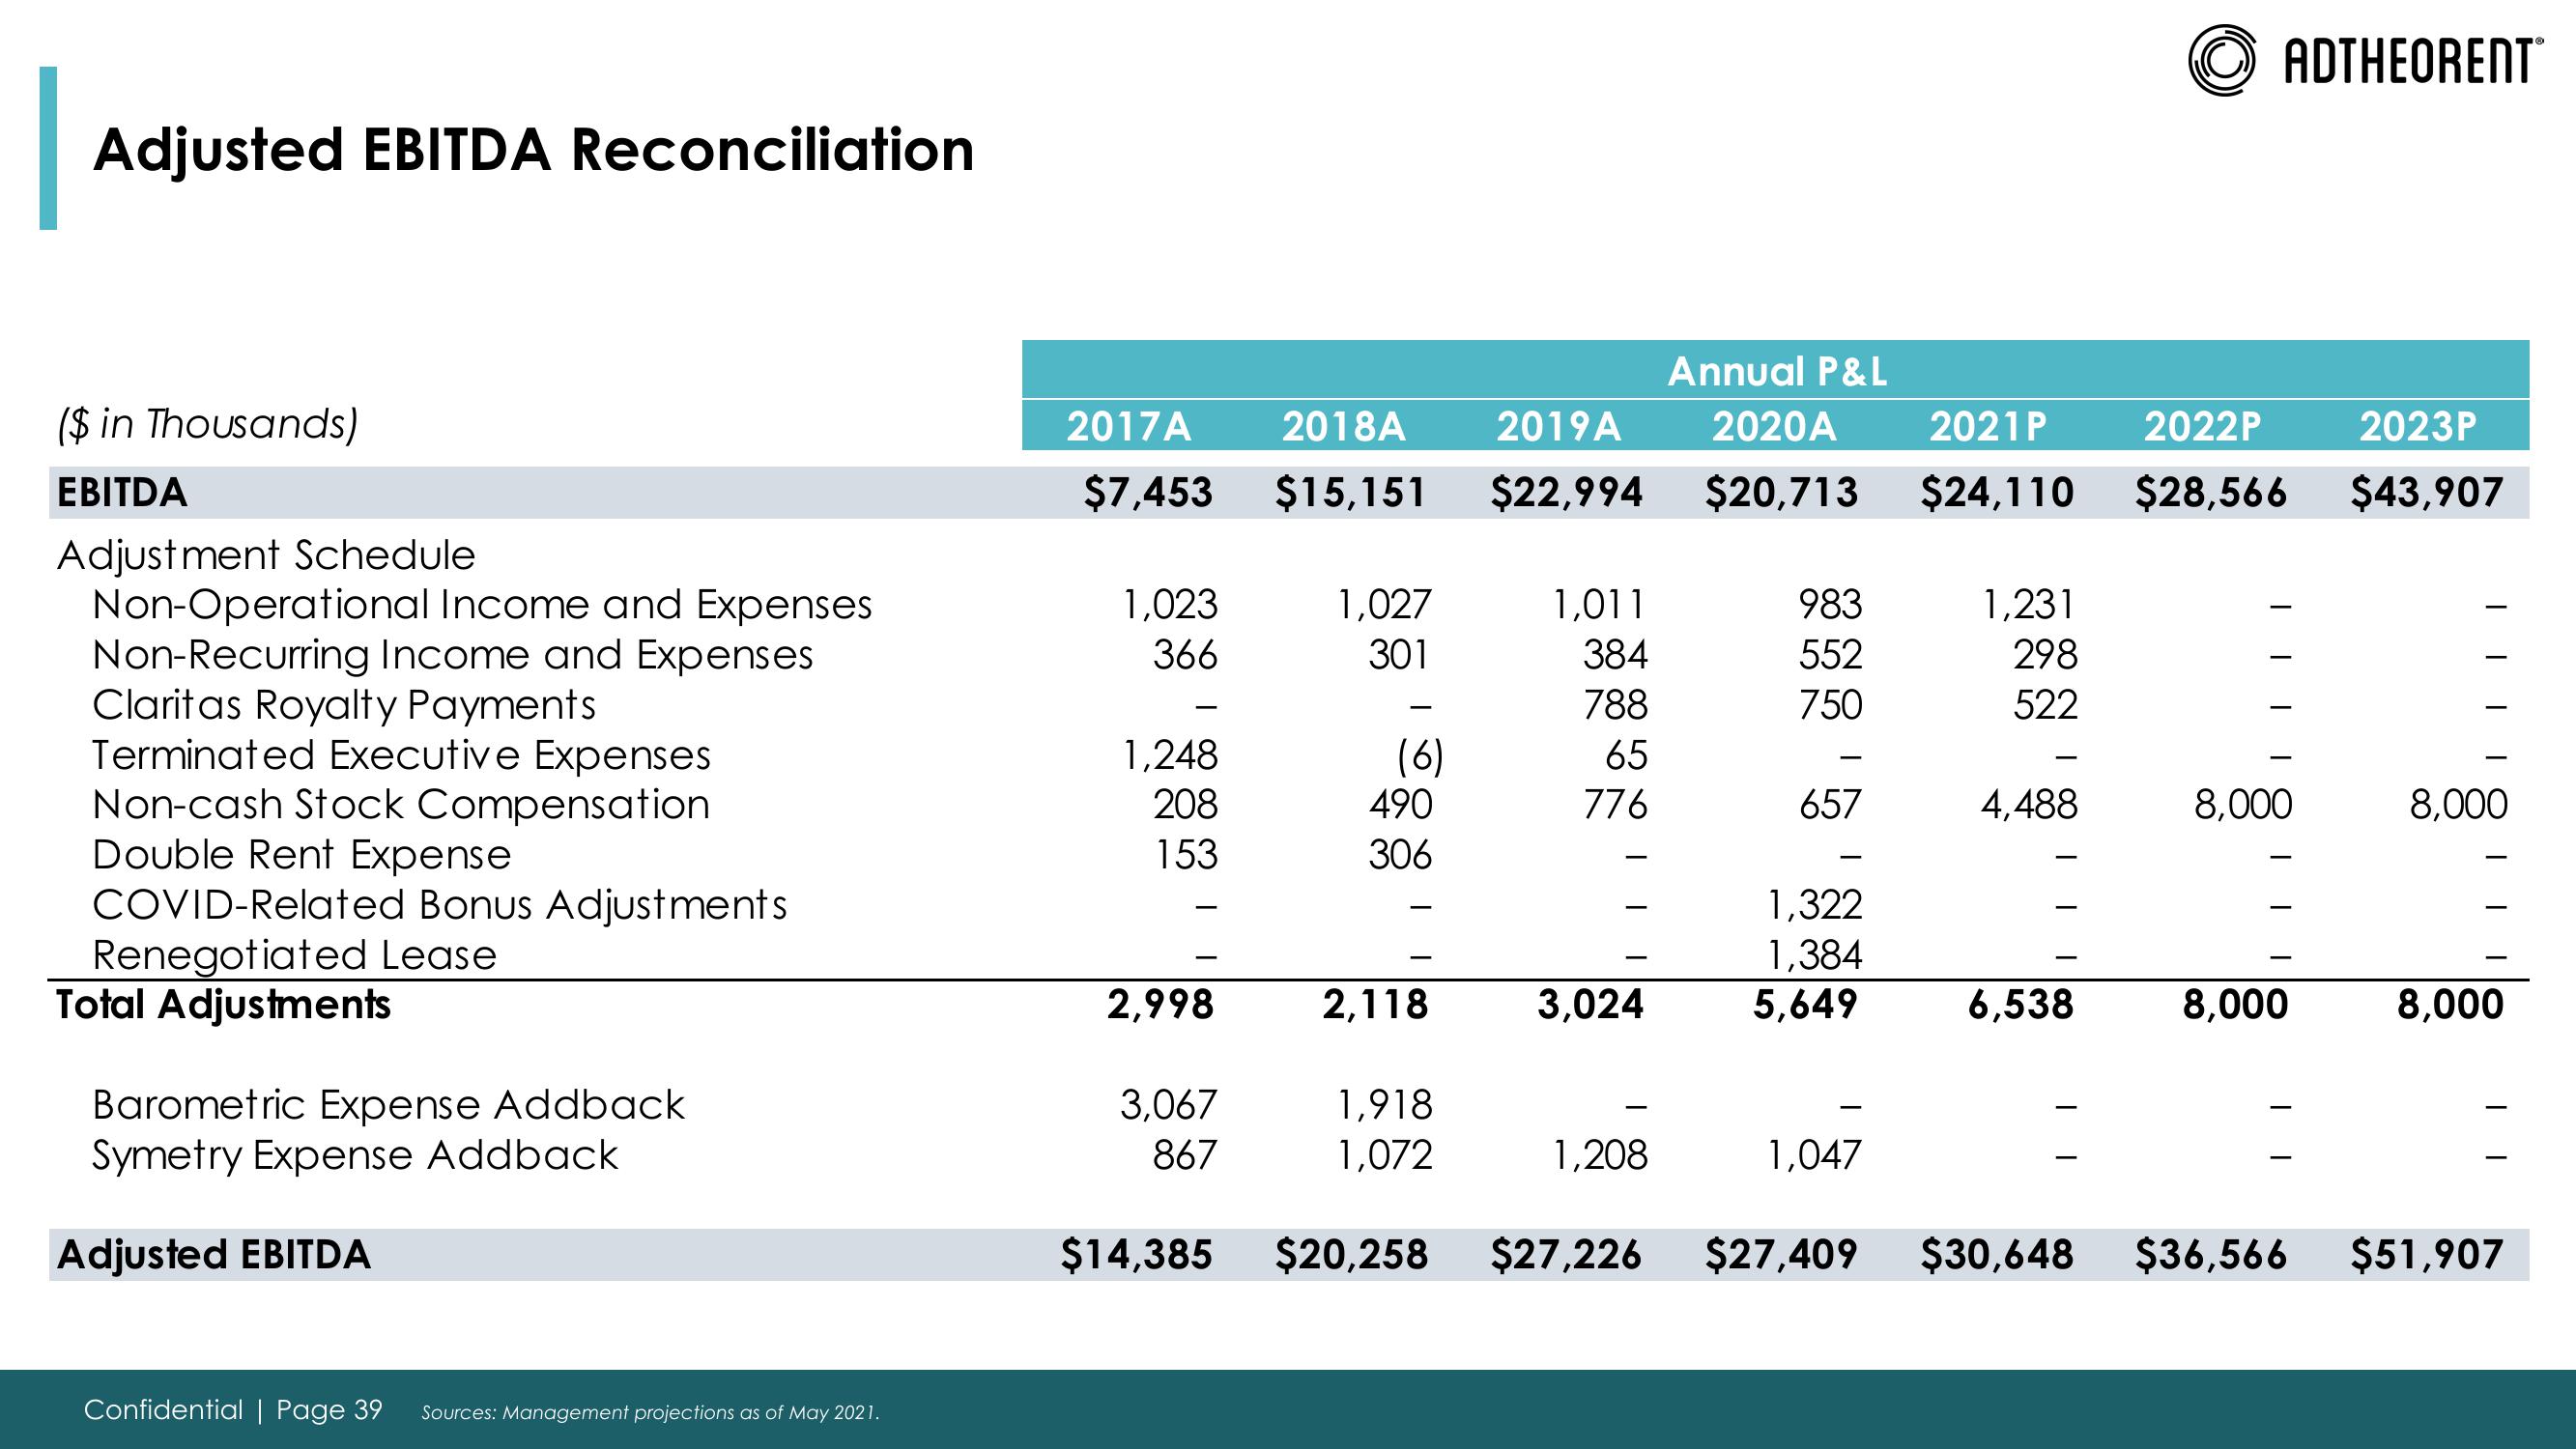
Adjusted EBITDA Reconciliation
($ in Thousands)
EBITDA
Adjustment Schedule
Non-Operational Income and Expenses
Non-Recurring Income and Expenses
Claritas Royalty Payments
Terminated Executive Expenses
Non-cash Stock Compensation
Double Rent Expense
COVID-Related Bonus Adjustments
Renegotiated Lease
Total Adjustments
Barometric Expense Addback
Symetry Expense Addback
Adjusted EBITDA
Confidential | Page 39 Sources: Management projections as of May 2021.
2017A
2018A
2019A
$7,453 $15,151 $22,994
1,023
366
1,248
208
153
2,998
3,067
867
1,027
301
(6)
490
306
2,118
1,918
1,072
1,011
384
788
65
776
3,024
1,208
Annual P&L
2020A
2021P
2022P
$20,713 $24,110 $28,566
983
552
750
657
1,322
1,384
5,649
1,047
1,231
298
522
4,488
ADTHEORENTⓇ
6,538
8,000
8,000
$14,385 $20,258 $27,226 $27,409 $30,648 $36,566
2023P
$43,907
8,000
8,000
$51,907View entire presentation