Babylon Investor Presentation Deck
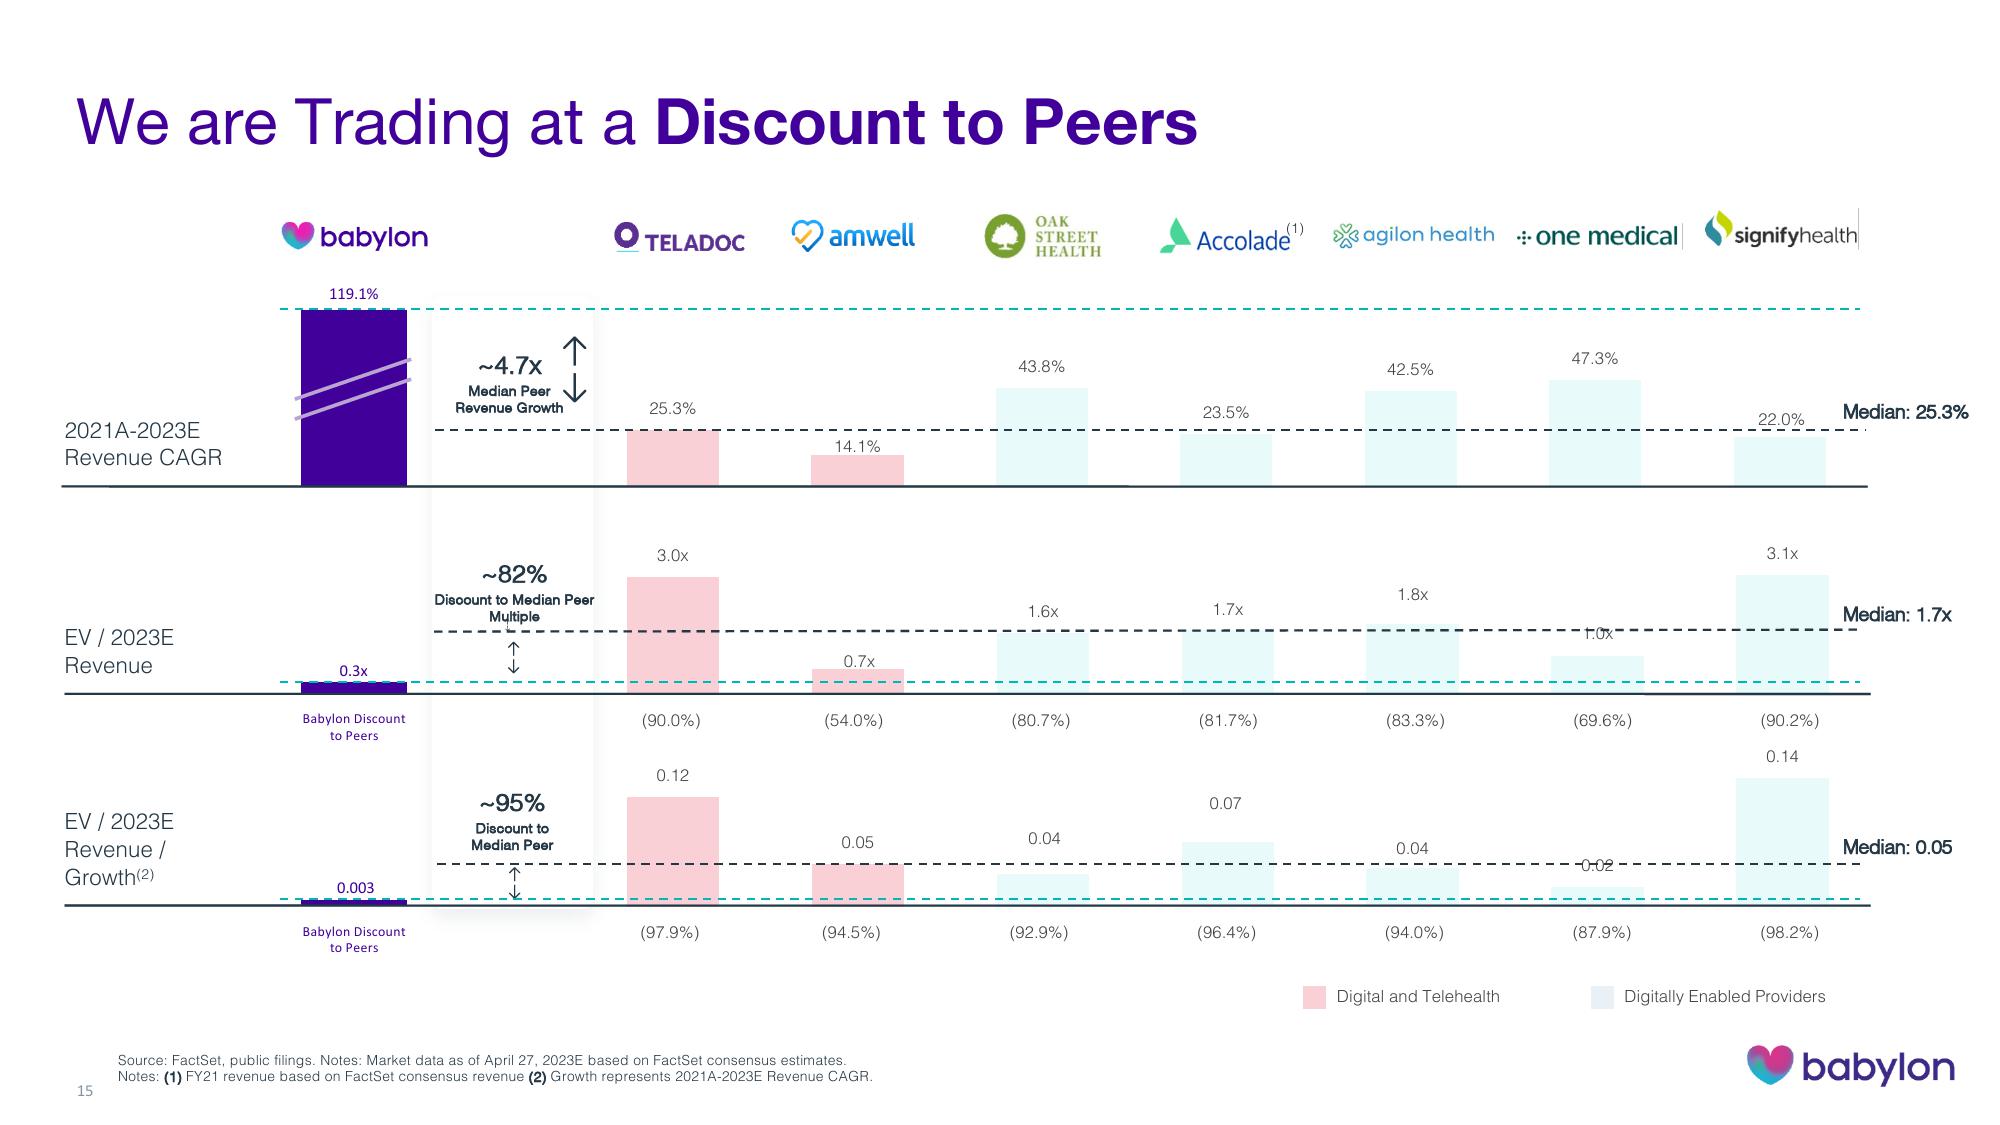
We are Trading at a Discount to Peers
2021A-2023E
Revenue CAGR
EV / 2023E
Revenue
EV/ 2023E
Revenue /
Growth(2)
15
babylon
119.1%
0.3x
Babylon Discount
to Peers
0.003
Babylon Discount
to Peers
~4.7x
Median Peer
Revenue Growth
~82%
Discount to Median Peer
Multiple
I
~95%
Discount to
Median Peer
TELADOC
25.3%
3.0x
(90.0%)
0.12
(97.9%)
amwell
14.1%
0.7x
(54.0%)
0.05
(94.5%)
Source: FactSet, public filings. Notes: Market data as of April 27, 2023E based on FactSet consensus estimates.
Notes: (1) FY21 revenue based on FactSet consensus revenue (2) Growth represents 2021A-2023E Revenue CAGR.
OAK
STREET
HEALTH
43.8%
1.6x
(80.7%)
0.04
(92.9%)
Accolade
23.5%
1.7x
(81.7%)
0.07
(96.4%)
agilon health one medical
42.5%
1.8x
(83.3%)
0.04
(94.0%)
Digital and Telehealth
47.3%
tox-
(69.6%)
-0.02
(87.9%)
signifyhealth
22.0%
3.1x
(90.2%)
0.14
(98.2%)
Digitally Enabled Providers
Median: 25.3%
Median: 1.7x
Median: 0.05
babylonView entire presentation