Alimentation Couche-Tard Investor Presentation
NON-IFRS MEASURES
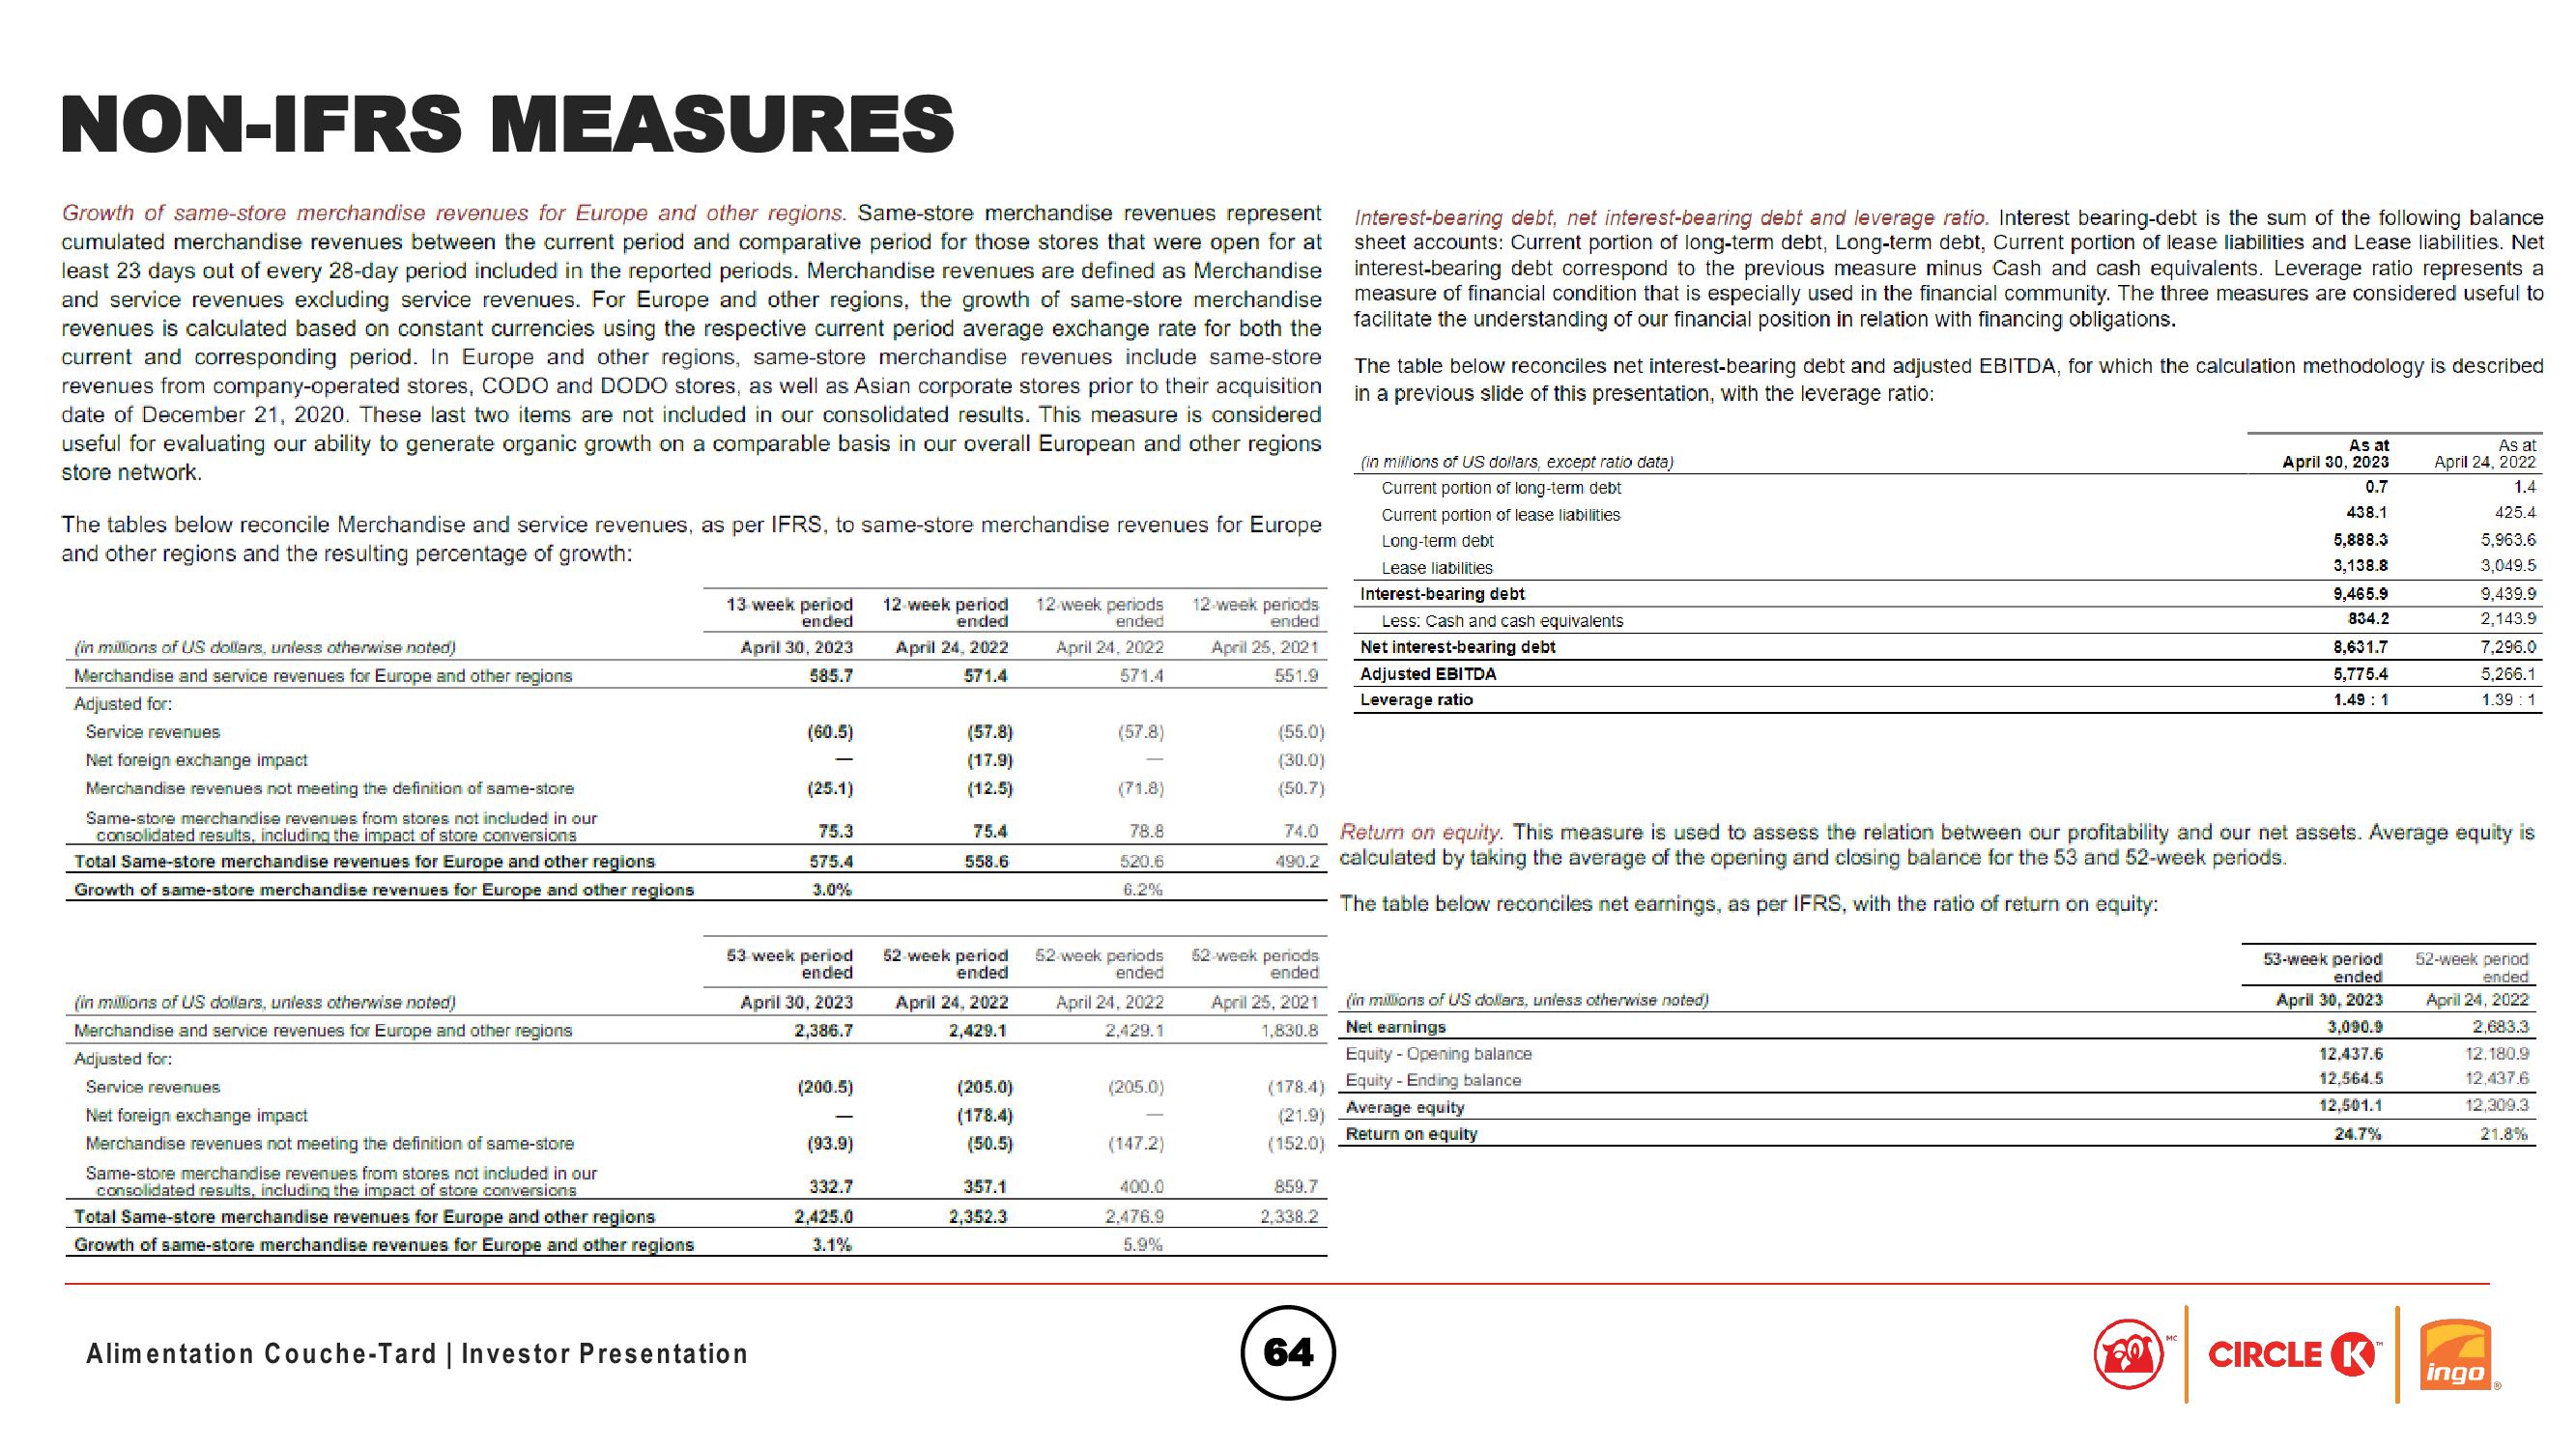
Growth of same-store merchandise revenues for Europe and other regions. Same-store merchandise revenues represent
cumulated merchandise revenues between the current period and comparative period for those stores that were open for at
least 23 days out of every 28-day period included in the reported periods. Merchandise revenues are defined as Merchandise
and service revenues excluding service revenues. For Europe and other regions, the growth of same-store merchandise
revenues is calculated based on constant currencies using the respective current period average exchange rate for both the
current and corresponding period. In Europe and other regions, same-store merchandise revenues include same-store
revenues from company-operated stores, CODO and DODO stores, as well as Asian corporate stores prior to their acquisition
date of December 21, 2020. These last two items are not included in our consolidated results. This measure is considered
useful for evaluating our ability to generate organic growth on a comparable basis in our overall European and other regions
store network.
The tables below reconcile Merchandise and service revenues, as per IFRS, to same-store merchandise revenues for Europe
and other regions and the resulting percentage of growth:
(in millions of US dollars, unless otherwise noted)
Merchandise and service revenues for Europe and other regions
Adjusted for:
Service revenues
Net foreign exchange impact
Merchandise revenues not meeting the definition of same-store
Same-store merchandise revenues from stores not included in our
consolidated results, including the impact of store conversions
Total Same-store merchandise revenues for Europe and other regions
Growth of same-store merchandise revenues for Europe and other regions
12-week periods
ended
Interest-bearing debt, net interest-bearing debt and leverage ratio. Interest bearing-debt is the sum of the following balance
sheet accounts: Current portion of long-term debt, Long-term debt, Current portion of lease liabilities and Lease liabilities. Net
interest-bearing debt correspond to the previous measure minus Cash and cash equivalents. Leverage ratio represents a
measure of financial condition that is especially used in the financial community. The three measures are considered useful to
facilitate the understanding of our financial position in relation with financing obligations.
The table below reconciles net interest-bearing debt and adjusted EBITDA, for which the calculation methodology is described
in a previous slide of this presentation, with the leverage ratio:
(in millions of US dollars, except ratio data)
Current portion of long-term debt
Current portion of lease liabilities
Long-term debt
Lease liabilities
Interest-bearing debt
Less: Cash and cash equivalents
13 week period
ended
12 week period
ended
12-week periods
ended
April 30, 2023
April 24, 2022
April 24, 2022
585.7
571.4
571.4
April 25, 2021
551.9
Net interest-bearing debt
Adjusted EBITDA
Leverage ratio
(60.5)
(57.8)
(57.8)
(55.0)
(17.9)
(30.0)
(25.1)
(12.5)
(71.8)
(50.7)
75.3
75.4
78.8
74.0
575.4
558.6
520.6
3.0%
6.2%
As at
As at
April 30, 2023
0.7
April 24, 2022
1.4
438.1
425.4
5,888.3
5,963.6
3,138.8
3,049.5
9,465.9
9,439.9
834.2
2,143.9
8,631.7
7,296.0
5,775.4
5,266.1
1.49 1
1.39 1
Return on equity. This measure is used to assess the relation between our profitability and our net assets. Average equity is
490.2 calculated by taking the average of the opening and closing balance for the 53 and 52-week periods.
The table below reconciles net earnings, as per IFRS, with the ratio of return on equity:
53 week period
ended
April 30, 2023
52-week period
ended
April 24, 2022
2,386.7
2,429.1
52-week periods
ended
April 24, 2022
2,429.1
52-week periods
ended
April 25, 2021
1,830.8
(in millions of US dollars, unless otherwise noted)
Net earnings
(in millions of US dollars, unless otherwise noted)
Merchandise and service revenues for Europe and other regions
Adjusted for:
Service revenues
Net foreign exchange impact
Merchandise revenues not meeting the definition of same-store
Same-store merchandise revenues from stores not included in our
consolidated results, including the impact of store conversions
Equity - Opening balance
(200.5)
(205.0)
(205.0)
(178.4)
Equity - Ending balance
Average equity
(178.4)
(21.9)
Return on equity
(93.9)
(50.5)
(147.2)
(152.0)
332.7
357.1
400.0
859.7
Total Same-store merchandise revenues for Europe and other regions
Growth of same-store merchandise revenues for Europe and other regions
2,425.0
2,352.3
2,476.9
2.338.2
3.1%
5.9%
Alimentation Couche-Tard | Investor Presentation
64
5.9
3
53-week period
ended
April 30, 2023
3,090.9
52-week period
ended
April 24, 2022
2,683.3
12.437.6
12.180.9
12,564.5
12.437.6
12,501.1
12,309.3
24.7%
21.8%
CIRCLE K
ingoView entire presentation