Bunzl Results Presentation Deck
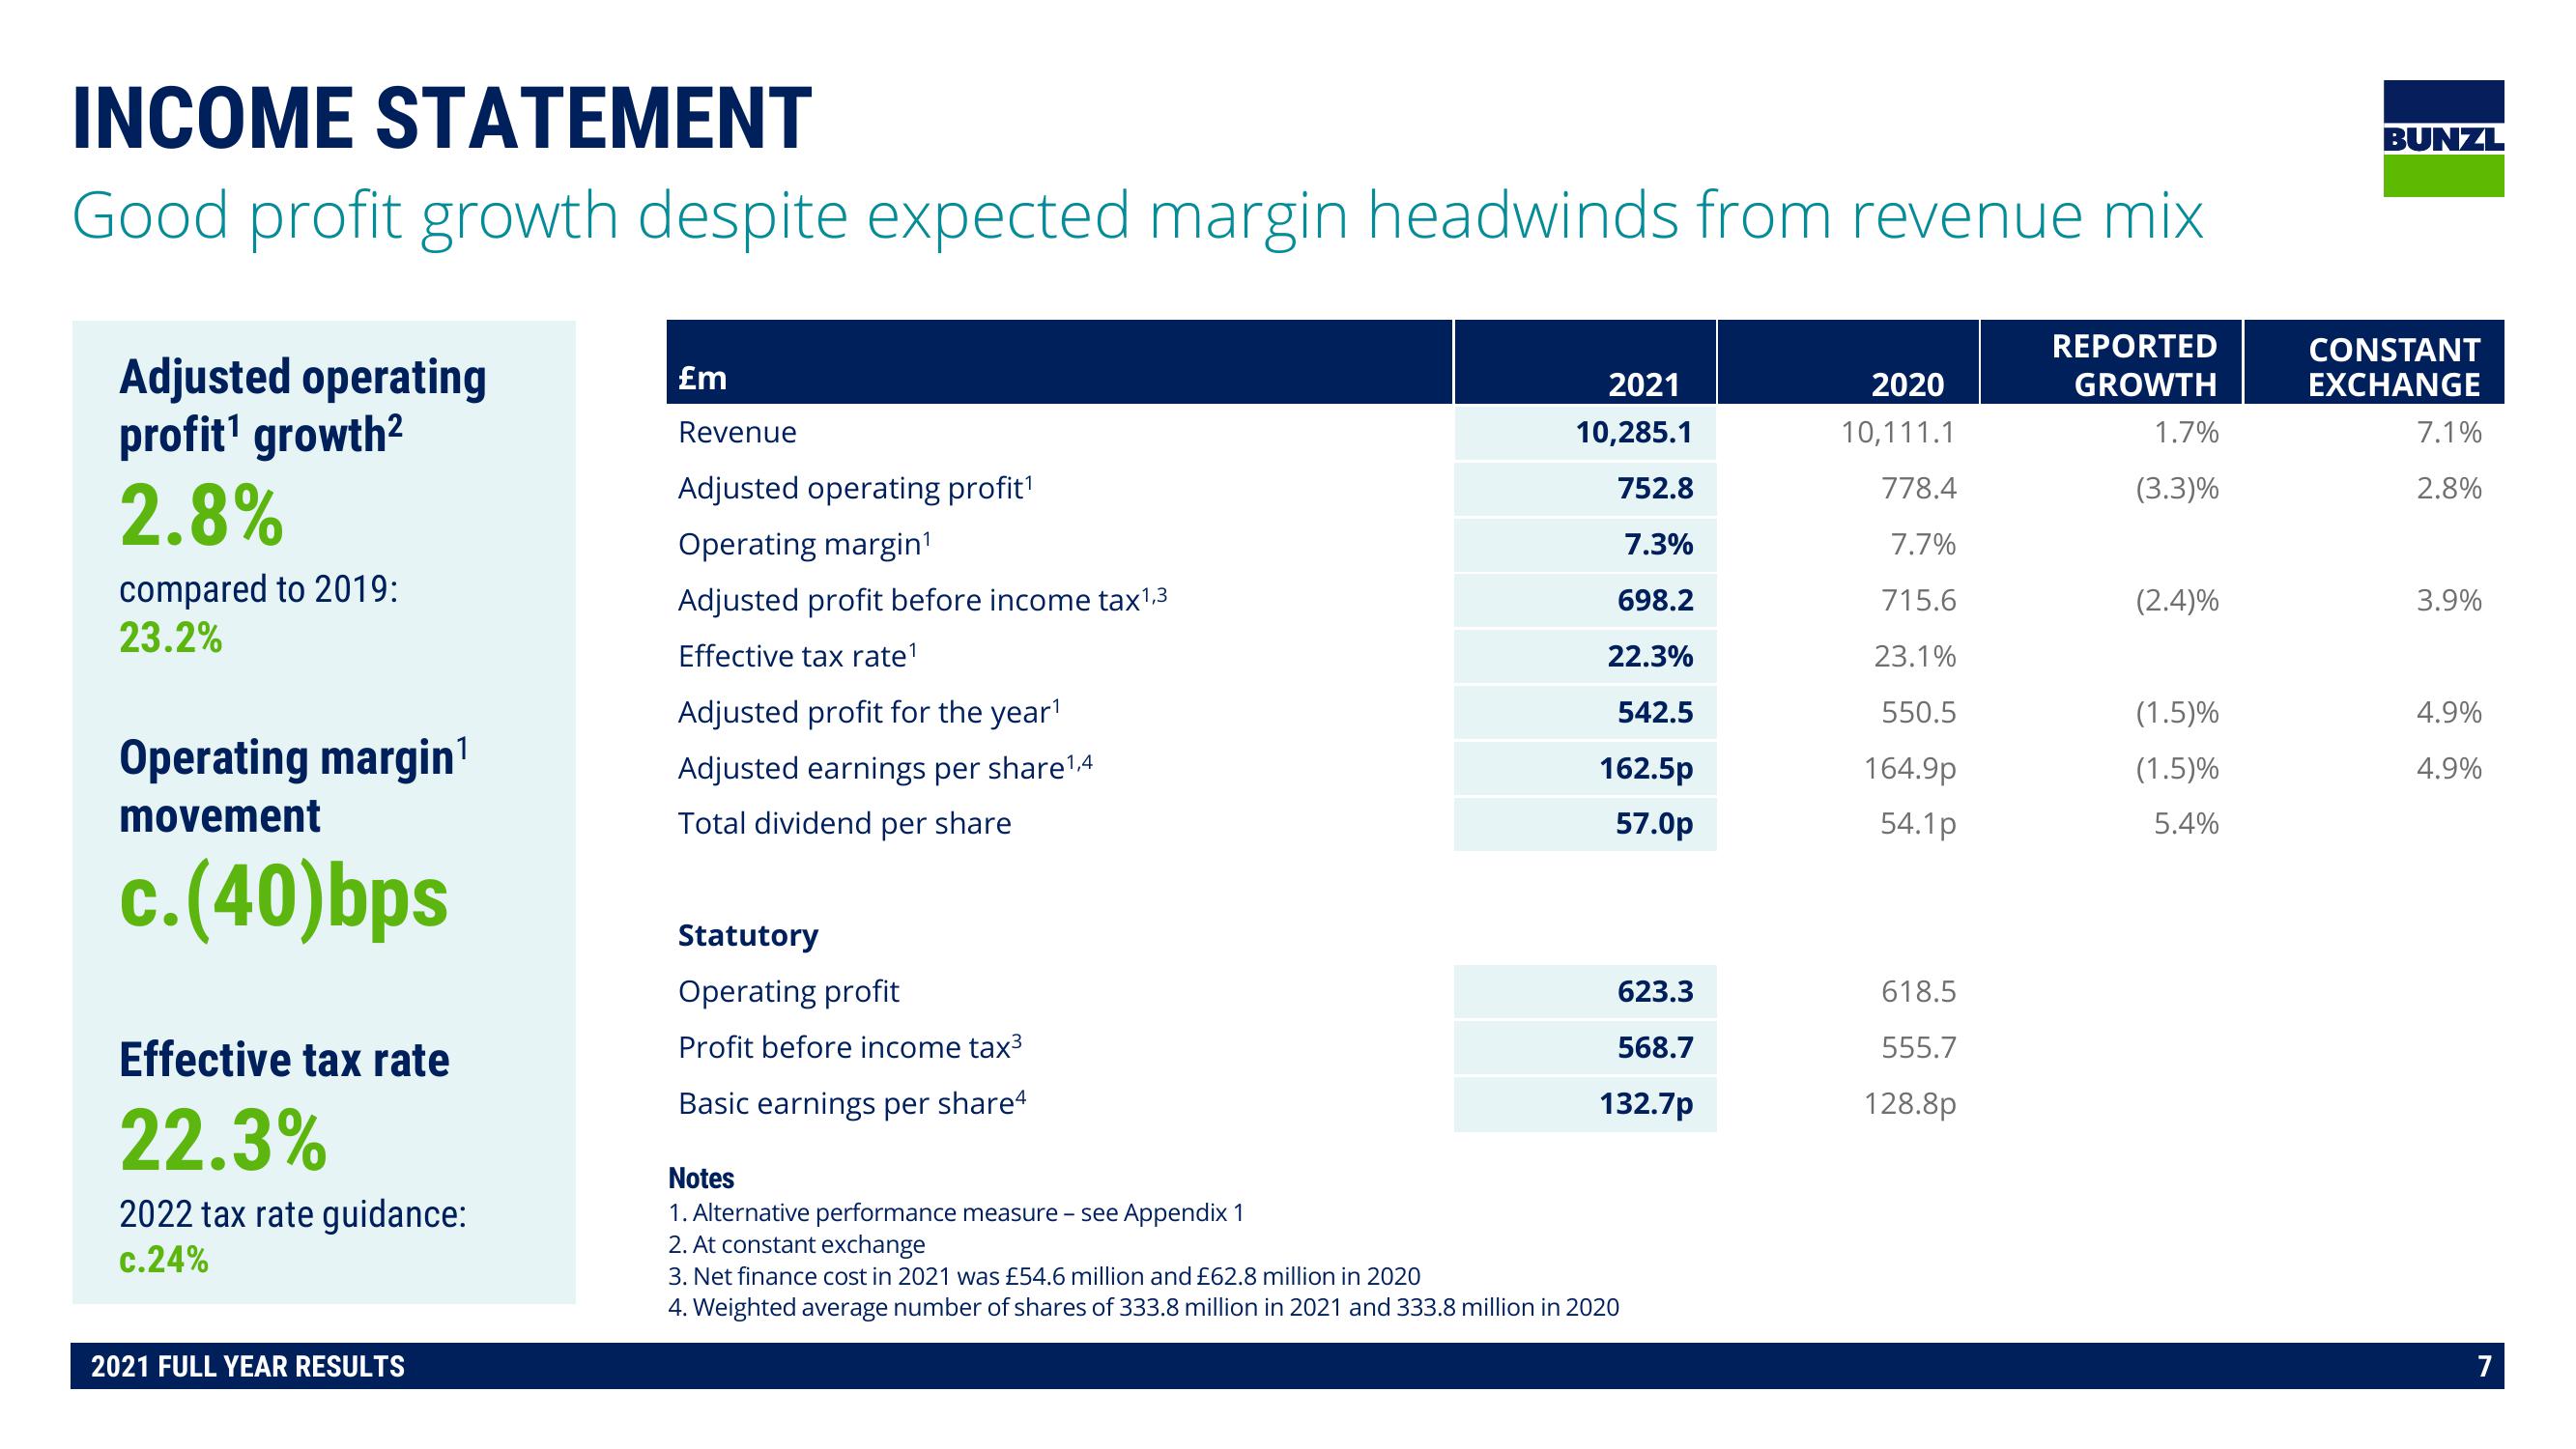
INCOME STATEMENT
Good profit growth despite expected margin headwinds from revenue mix
Adjusted operating
profit¹ growth²
2.8%
compared to 2019:
23.2%
Operating margin¹
movement
c.(40)bps
Effective tax rate
22.3%
2022 tax rate guidance:
c.24%
2021 FULL YEAR RESULTS
£m
Revenue
Adjusted operating profit¹
Operating margin¹
Adjusted profit before income tax¹,3
Effective tax rate¹
Adjusted profit for the year¹
Adjusted earnings per share¹,4
Total dividend per share
Statutory
Operating profit
Profit before income tax³
Basic earnings per share4
2021
10,285.1
752.8
7.3%
698.2
22.3%
542.5
162.5p
57.0p
623.3
568.7
132.7p
Notes
1. Alternative performance measure - see Appendix 1
2. At constant exchange
3. Net finance cost in 2021 was £54.6 million and £62.8 million in 2020
4. Weighted average number of shares of 333.8 million in 2021 and 333.8 million in 2020
2020
10,111.1
778.4
7.7%
715.6
23.1%
550.5
164.9p
54.1p
618.5
555.7
128.8p
REPORTED
GROWTH
1.7%
(3.3)%
(2.4)%
(1.5)%
(1.5)%
5.4%
BUNZL
CONSTANT
EXCHANGE
7.1%
2.8%
3.9%
4.9%
4.9%
7View entire presentation