Shopify Investor Day Presentation Deck
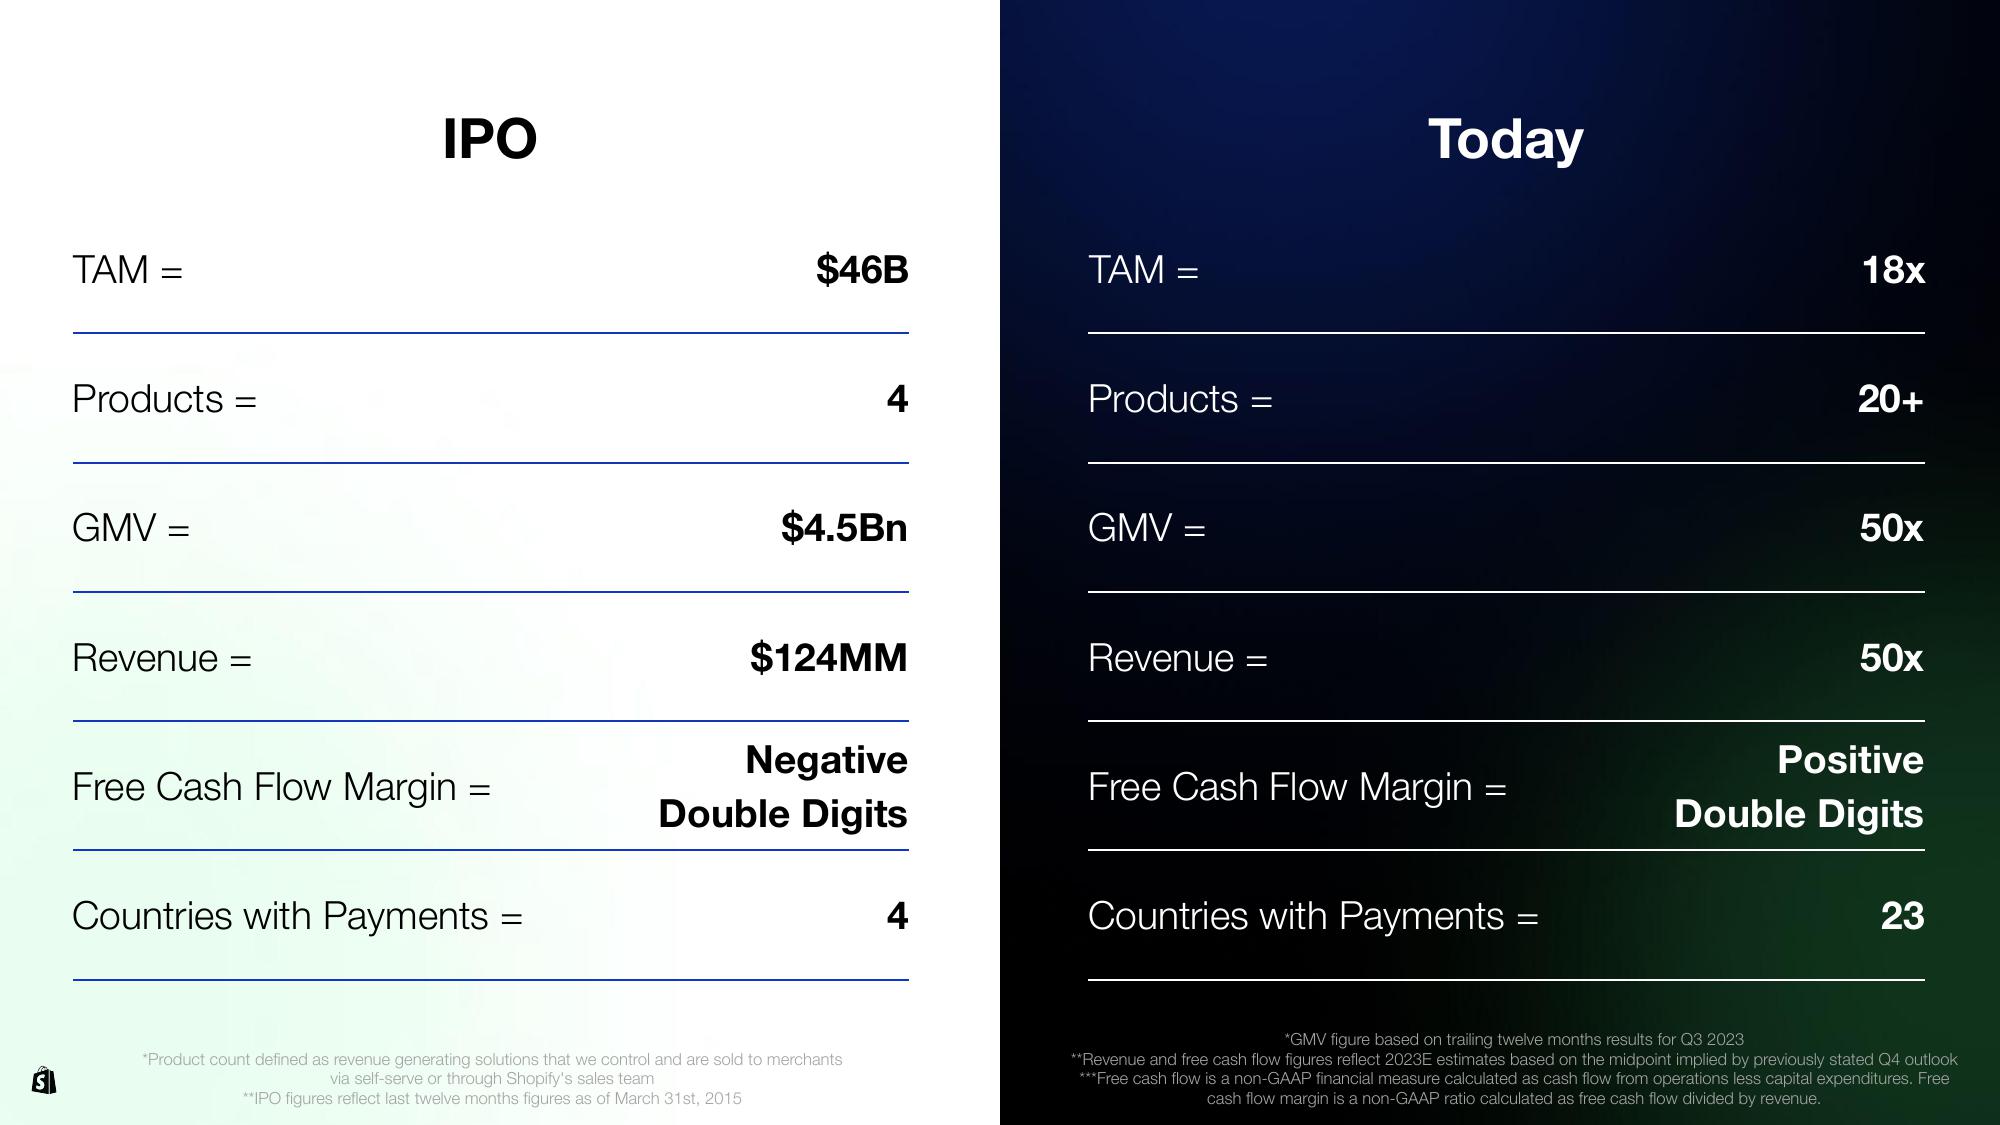
TAM
Products =
GMV =
Revenue: =
IPO
Free Cash Flow Margin =
=
Countries with Payments =
$46B
4
$4.5Bn
$124MM
Negative
Double Digits
*Product count defined as revenue generating solutions that we control and are sold to merchants
via self-serve or through Shopify's sales team
**IPO figures reflect last twelve months figures as of March 31st, 2015
4
TAM
=
Products =
GMV =
Revenue =
Today
Free Cash Flow Margin =
Countries with Payments
=
18x
20+
50x
50x
Positive
Double Digits
23
*GMV figure based on trailing twelve months results for Q3 2023
**Revenue and free cash flow figures reflect 2023E estimates based on the midpoint implied by previously stated Q4 outlook
***Free cash flow is a non-GAAP financial measure calculated as cash flow from operations less capital expenditures. Free
cash flow margin is a non-GAAP ratio calculated as free cash flow divided by revenue.View entire presentation