Disney Results Presentation Deck
Linear Networks
Direct-to-Consumer
CSLO
Elimination of
Intrasegment
Revenues (¹)
Linear Networks
Direct-to-Consumer
CSLO
Q2 Media & Entertainment Distribution Results
(In Billions)
$7.1
$4.9
$2.8
$1.9
Q2'22
$0.0
($0.9)
Revenues
($0.3)
Q2'22
$6.6
Operating Income (Loss)
$5.5
$1.8
$2.2
Q2'23
($0.3)
($0.1)
($0.7)
Q2'23
Linear Networks
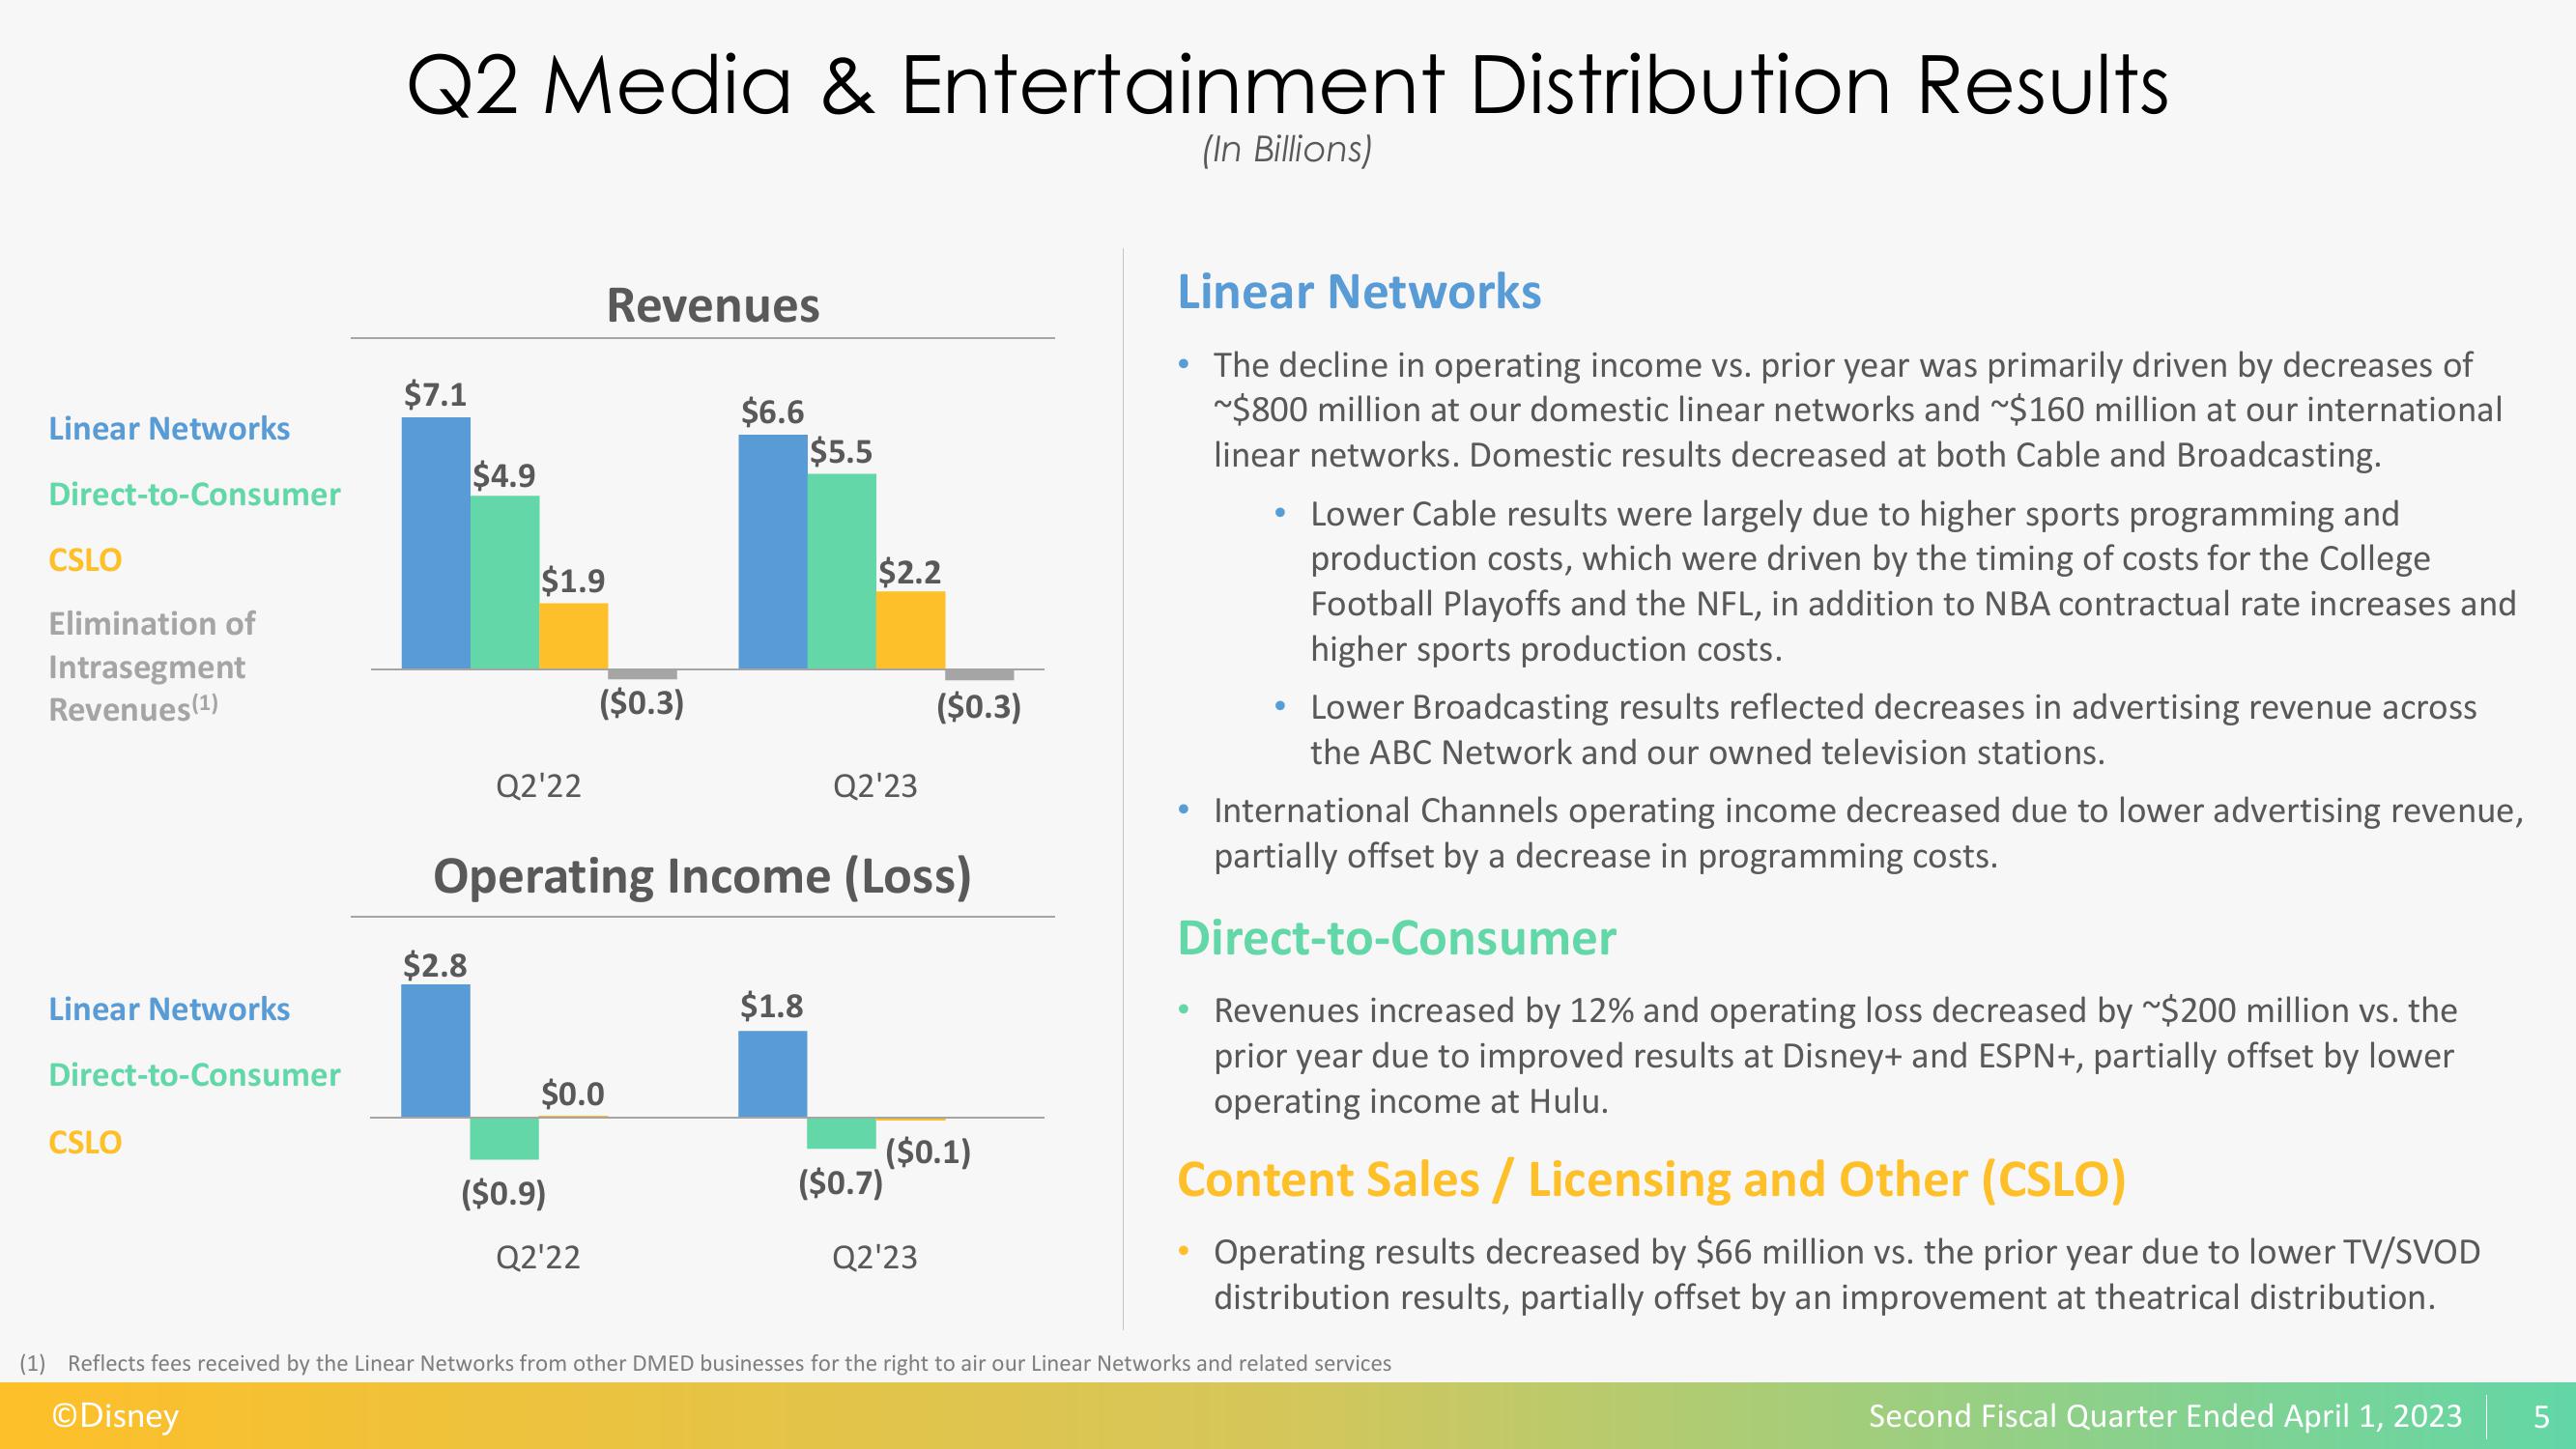
The decline in operating income vs. prior year was primarily driven by decreases of
~$800 million at our domestic linear networks and ~$160 million at our international
linear networks. Domestic results decreased at both Cable and Broadcasting.
• Lower Cable results were largely due to higher sports programming and
production costs, which were driven by the timing of costs for the College
Football Playoffs and the NFL, in addition to NBA contractual rate increases and
higher sports production costs.
Lower Broadcasting results reflected decreases in advertising revenue across
the ABC Network and our owned television stations.
• International Channels operating income decreased due to lower advertising revenue,
partially offset by a decrease in programming costs.
Direct-to-Consumer
●
the
Revenues increased by 12% and operating loss decreased by ~$200 million vs.
prior year due to improved results at Disney+ and ESPN+, partially offset by lower
operating income at Hulu.
Content Sales / Licensing and Other (CSLO)
Operating results decreased by $66 million vs. the prior year due to lower TV/SVOD
distribution results, partially offset by an improvement at theatrical distribution.
(1) Reflects fees received by the Linear Networks from other DMED businesses for the right to air our Linear Networks and related services
ⒸDisney
Second Fiscal Quarter Ended April 1, 2023
5View entire presentation