Main Street Capital Investor Day Presentation Deck
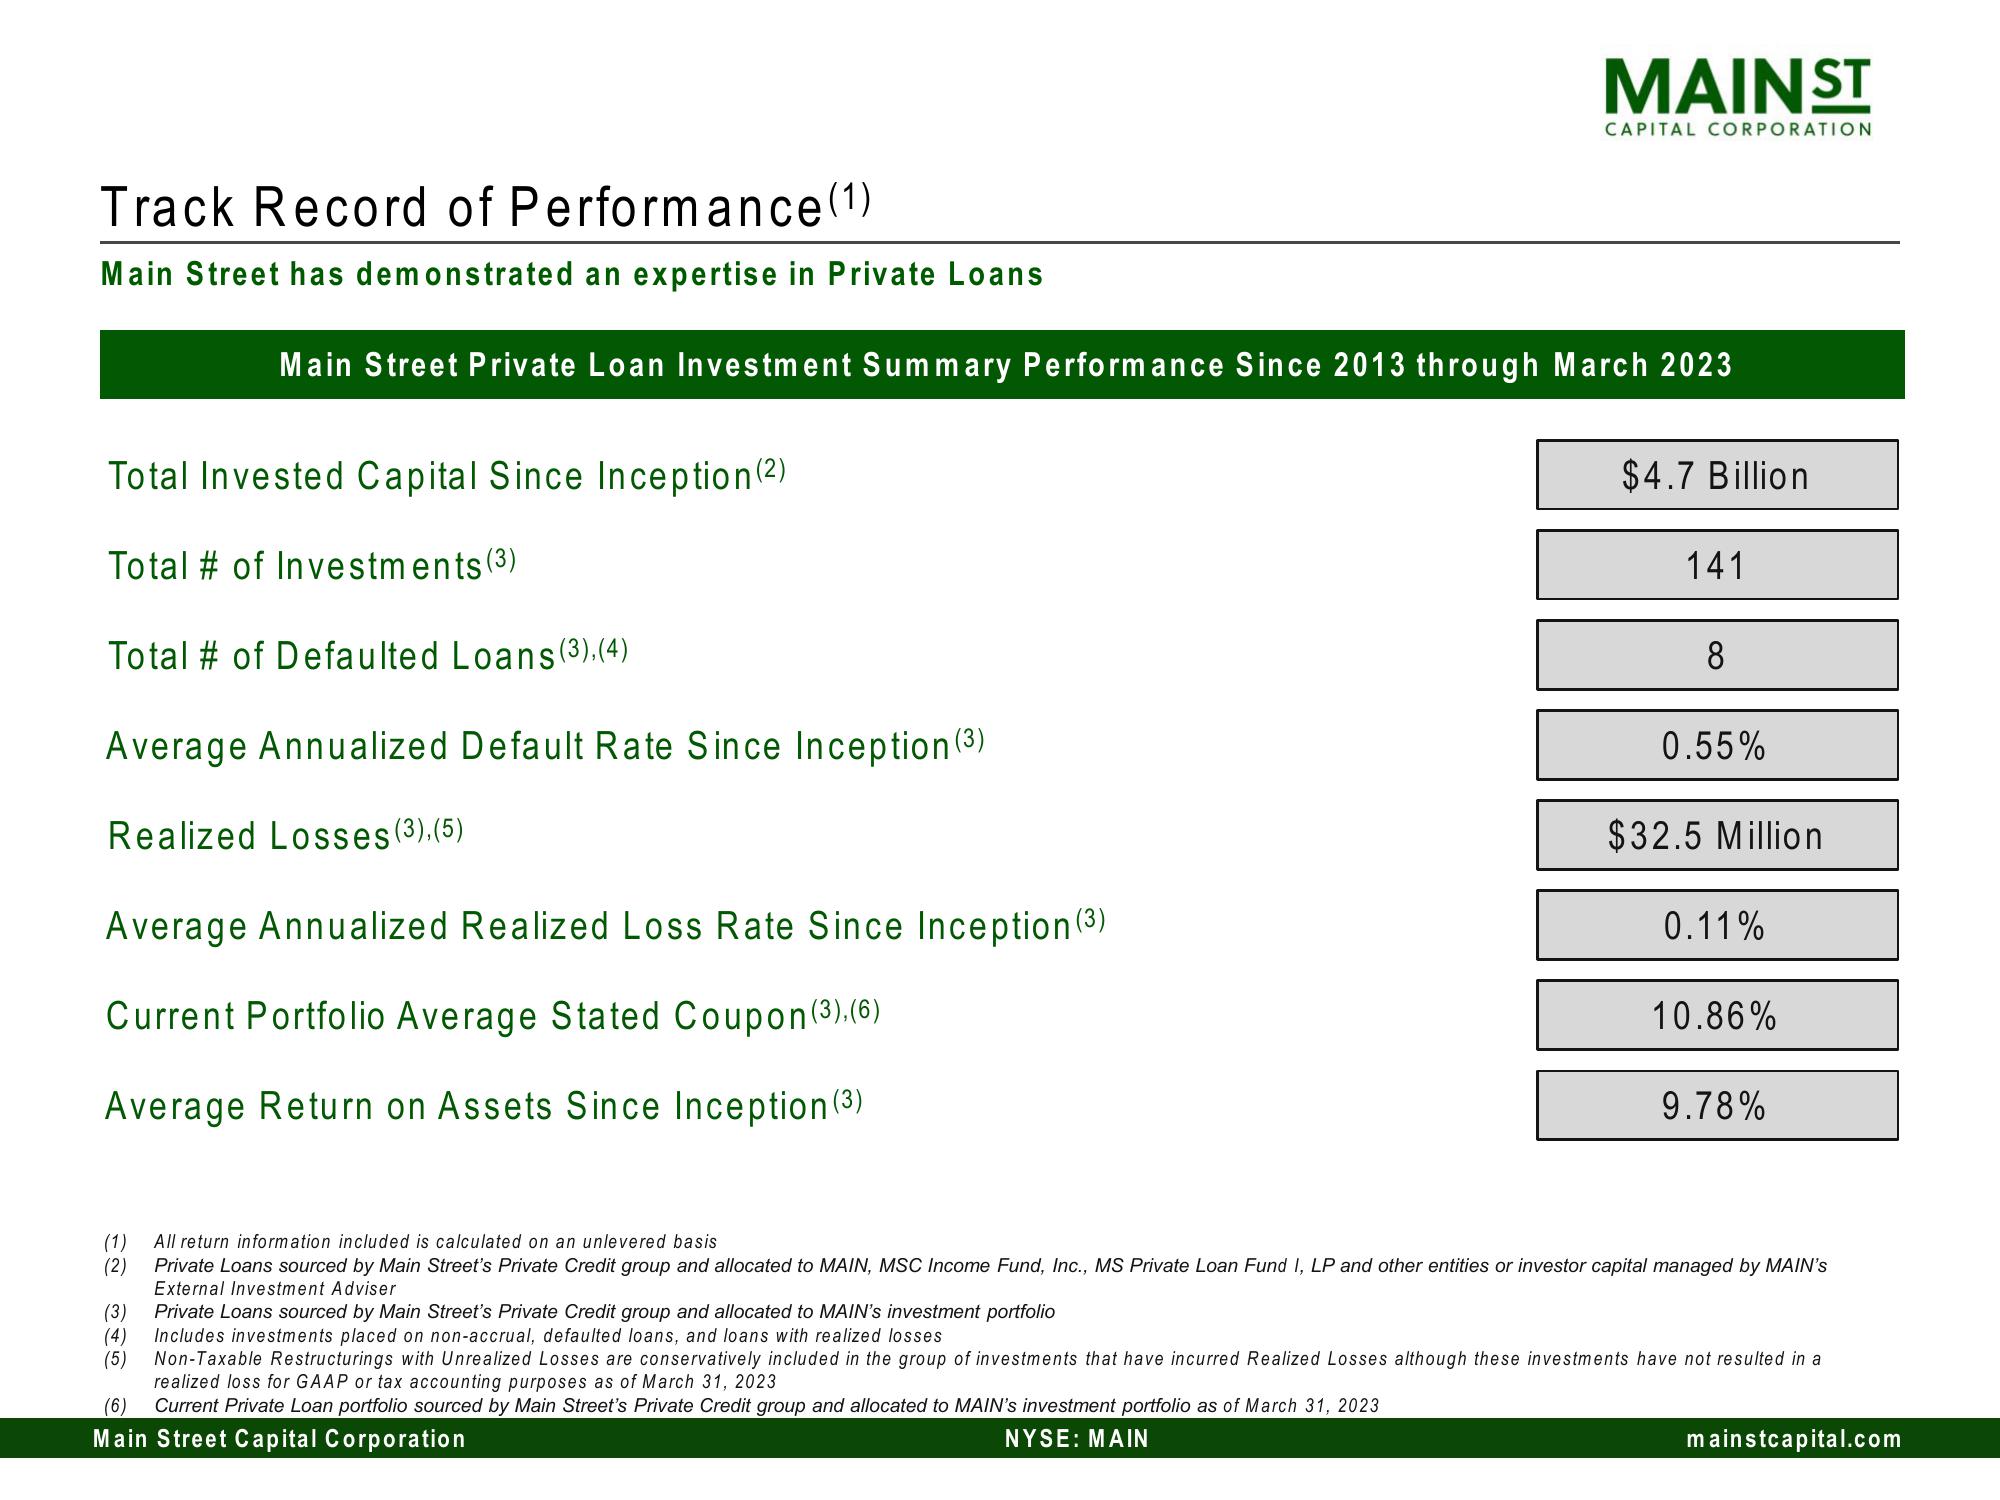
Track Record of Performance (1)
Main Street has demonstrated an expertise in Private Loans
MAIN ST
Total Invested Capital Since Inception (2)
Total # of Investments (3)
Total # of Defaulted Loans(3), (4)
Average Annualized Default Rate Since Inception (3)
Realized Losses (3).(5)
Average Annualized Realized Loss Rate Since Inception (3)
Current Portfolio Average Stated Coupon (3). (6)
Average Return on Assets Since Inception (3)
CAPITAL CORPORATION
Main Street Private Loan Investment Summary Performance Since 2013 through March 2023
$4.7 Billion
141
8
0.55%
$32.5 Million
0.11%
10.86%
9.78%
(1)
All return information included is calculated on an unlevered basis
(2) Private Loans sourced by Main Street's Private Credit group and allocated to MAIN, MSC Income Fund, Inc., MS Private Loan Fund I, LP and other entities or investor capital managed by MAIN's
External Investment Adviser
(3)
Private Loans sourced by Main Street's Private Credit group and allocated to MAIN's investment portfolio
(4) Includes investments placed on non-accrual, defaulted loans, and loans with realized losses
(5) Non-Taxable Restructurings with Unrealized Losses are conservatively included in the group of investments that have incurred Realized Losses although these investments have not resulted in a
realized loss for GAAP or tax accounting purposes as of March 31, 2023
(6) Current Private Loan portfolio sourced by Main Street's Private Credit group and allocated to MAIN's investment portfolio as of March 31, 2023
Main Street Capital Corporation
NYSE: MAIN
mainstcapital.comView entire presentation