Markforged SPAC Presentation Deck
Strong Path to Profitable Growth (Cont'd)
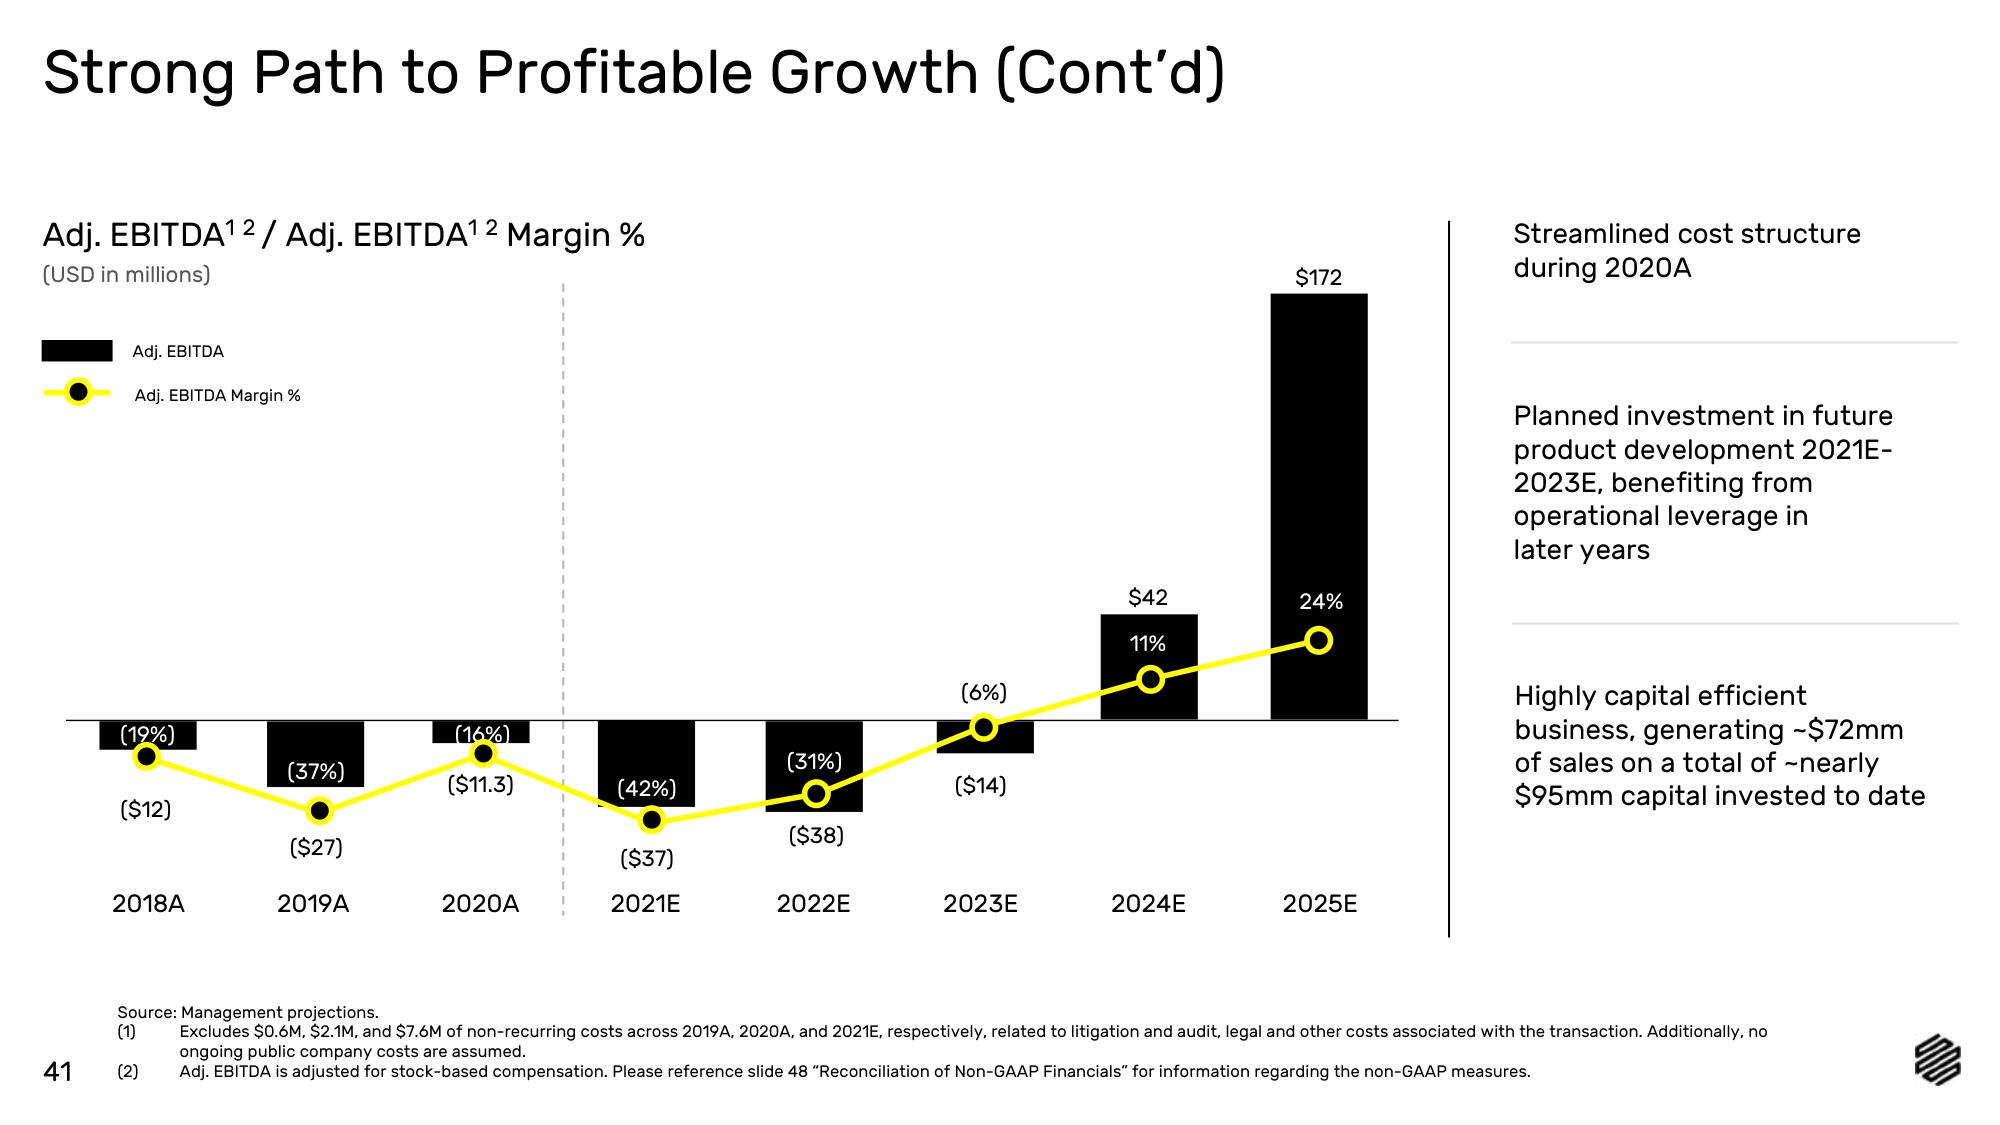
Adj. EBITDA¹2 / Adj. EBITDA¹2 Margin %
(USD in millions)
41
Adj. EBITDA
Adj. EBITDA Margin %
(19%)
($12)
2018A
(37%)
($27)
2019A
(16%)
($11.3)
2020A
(42%)
($37)
2021E
(31%)
($38)
2022E
(6%)
($14)
2023E
$42
11%
2024E
$172
24%
2025E
Streamlined cost structure
during 2020A
Planned investment in future
product development 2021E-
2023E, benefiting from
operational leverage in
later years
Highly capital efficient
business, generating -$72mm
of sales on a total of -nearly
$95mm capital invested to date
Source: Management projections.
(1)
Excludes $0.6M, $2.1M, and $7.6M of non-recurring costs across 2019A, 2020A, and 2021E, respectively, related to litigation and audit, legal and other costs associated with the transaction. Additionally, no
ongoing public company costs are assumed.
(2)
Adj. EBITDA is adjusted for stock-based compensation. Please reference slide 48 "Reconciliation of Non-GAAP Financials" for information regarding the non-GAAP measures.View entire presentation