Baird Investment Banking Pitch Book
Yield
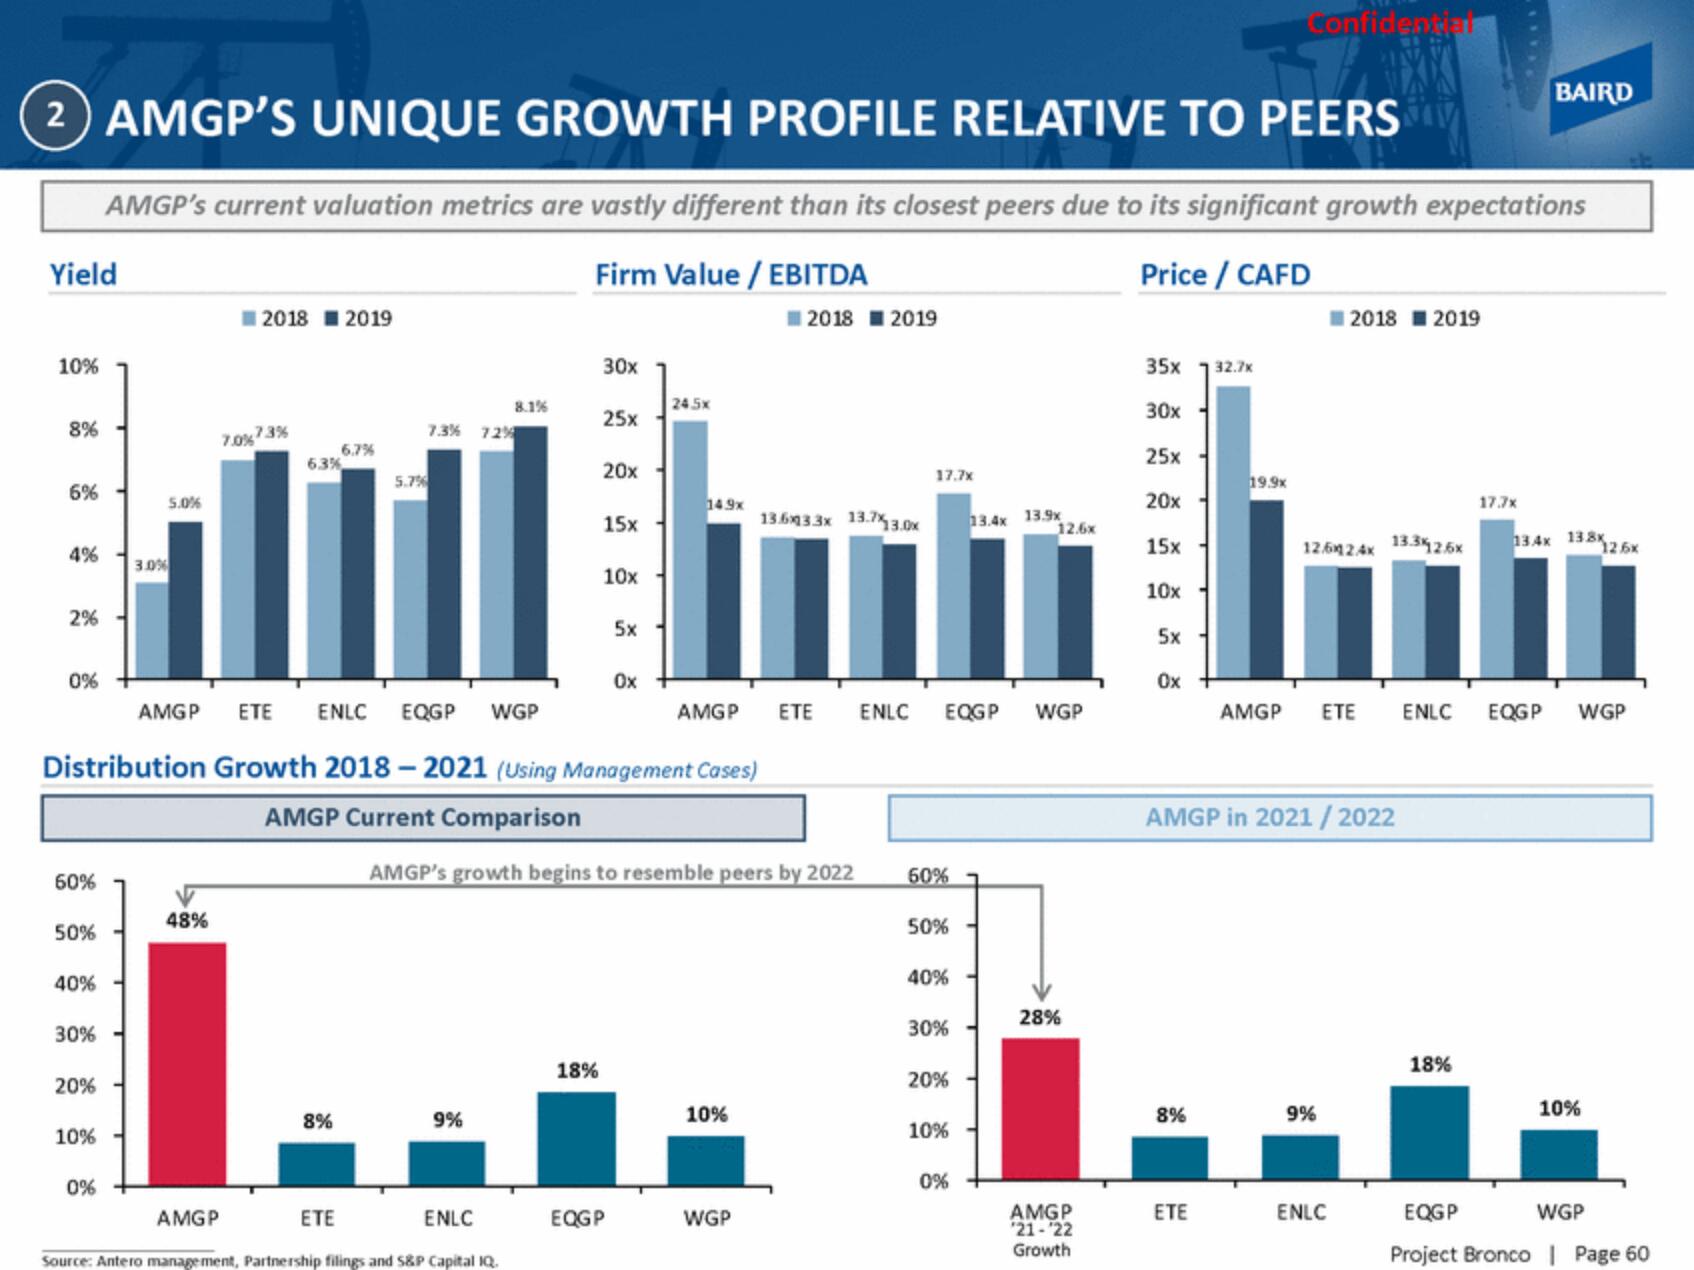
2) AMGP'S UNIQUE GROWTH PROFILE RELATIVE TO PEERS
AMGP's current valuation metrics are vastly different than its closest peers due to its significant growth expectations
Firm Value / EBITDA
Price / CAFD
10%
8%
6%
4%
2%
0%
60%
50%
40%
30%
20%
10%
5.0%
0%
3.0 %
2018 2019
48%
7.0% 7.3%
6.3%
6.7%
8%
ETE
7.3% 72%
5.7%
8.1%
AMGP ETE ENLC EQGP WGP
Distribution Growth 2018-2021 (Using Management Cases)
AMGP Current Comparison
9%
AMGP
ENLC
Source: Antero management, Partnership filings and S&P Capital IQ.
30x
25x
18%
20x
15x
10x
5x
Ox
EQGP
245,
14.9x
AMGP
AMGP's growth begins to resemble peers by 2022
10%
2018 2019
13.603.3x 13.7%13.0x
WGP
ΕΤΕ
ENLC
17.7x
60%
EQGP WGP
50%
40%
30%
20%
10%
13.4x 13.9x
0%
12.6x
28%
AMGP
'21-22
Growth
35x 32.7x
30x
25x
20x
15x
10x
5x
0x +
8%
19.9x
ETE
Confidential
AMGP
12.642.4x 13.3%2.5x
AMGP in 2021/2022
2018 2019
9%
ETE ENLC
ENLC
18%
BAIRD
17.7x
134x 138x
126x
EQGP WGP
10%
EQGP
WGP
Project Bronco | Page 60View entire presentation