PowerSchool Investor Presentation Deck
Non-GAAP Reconciliations
Adjusted Gross Profit
PowerSchool
($ in thousands, except percentages)
Gross Profit
Depreciation
Share-based compensation (¹)
Restructuring (2)
Acquisition-related expense(3)
Amortization
Adjusted Gross Profit
% Gross Profit Margin(4)
% Adjusted Gross Profit Margin(5)
Three Months Ended September 30,
2021
$ 85,620
489
1,324
905
233
12,604
$ 101,175
57.5%
PowerSchool Holdings, Inc.
67.9%
2020
$ 67,504
403
81
434
142
9,468
$ 78,032
58.4%
67.5%
Nine Months Ended September 30,
2021
$ 237,486
1,322
1,486
2,385
484
36,374
$ 279,537
57.6%
67.8%
2020
$ 180,238
1,172
242
851
330
27,616
$ 210,449
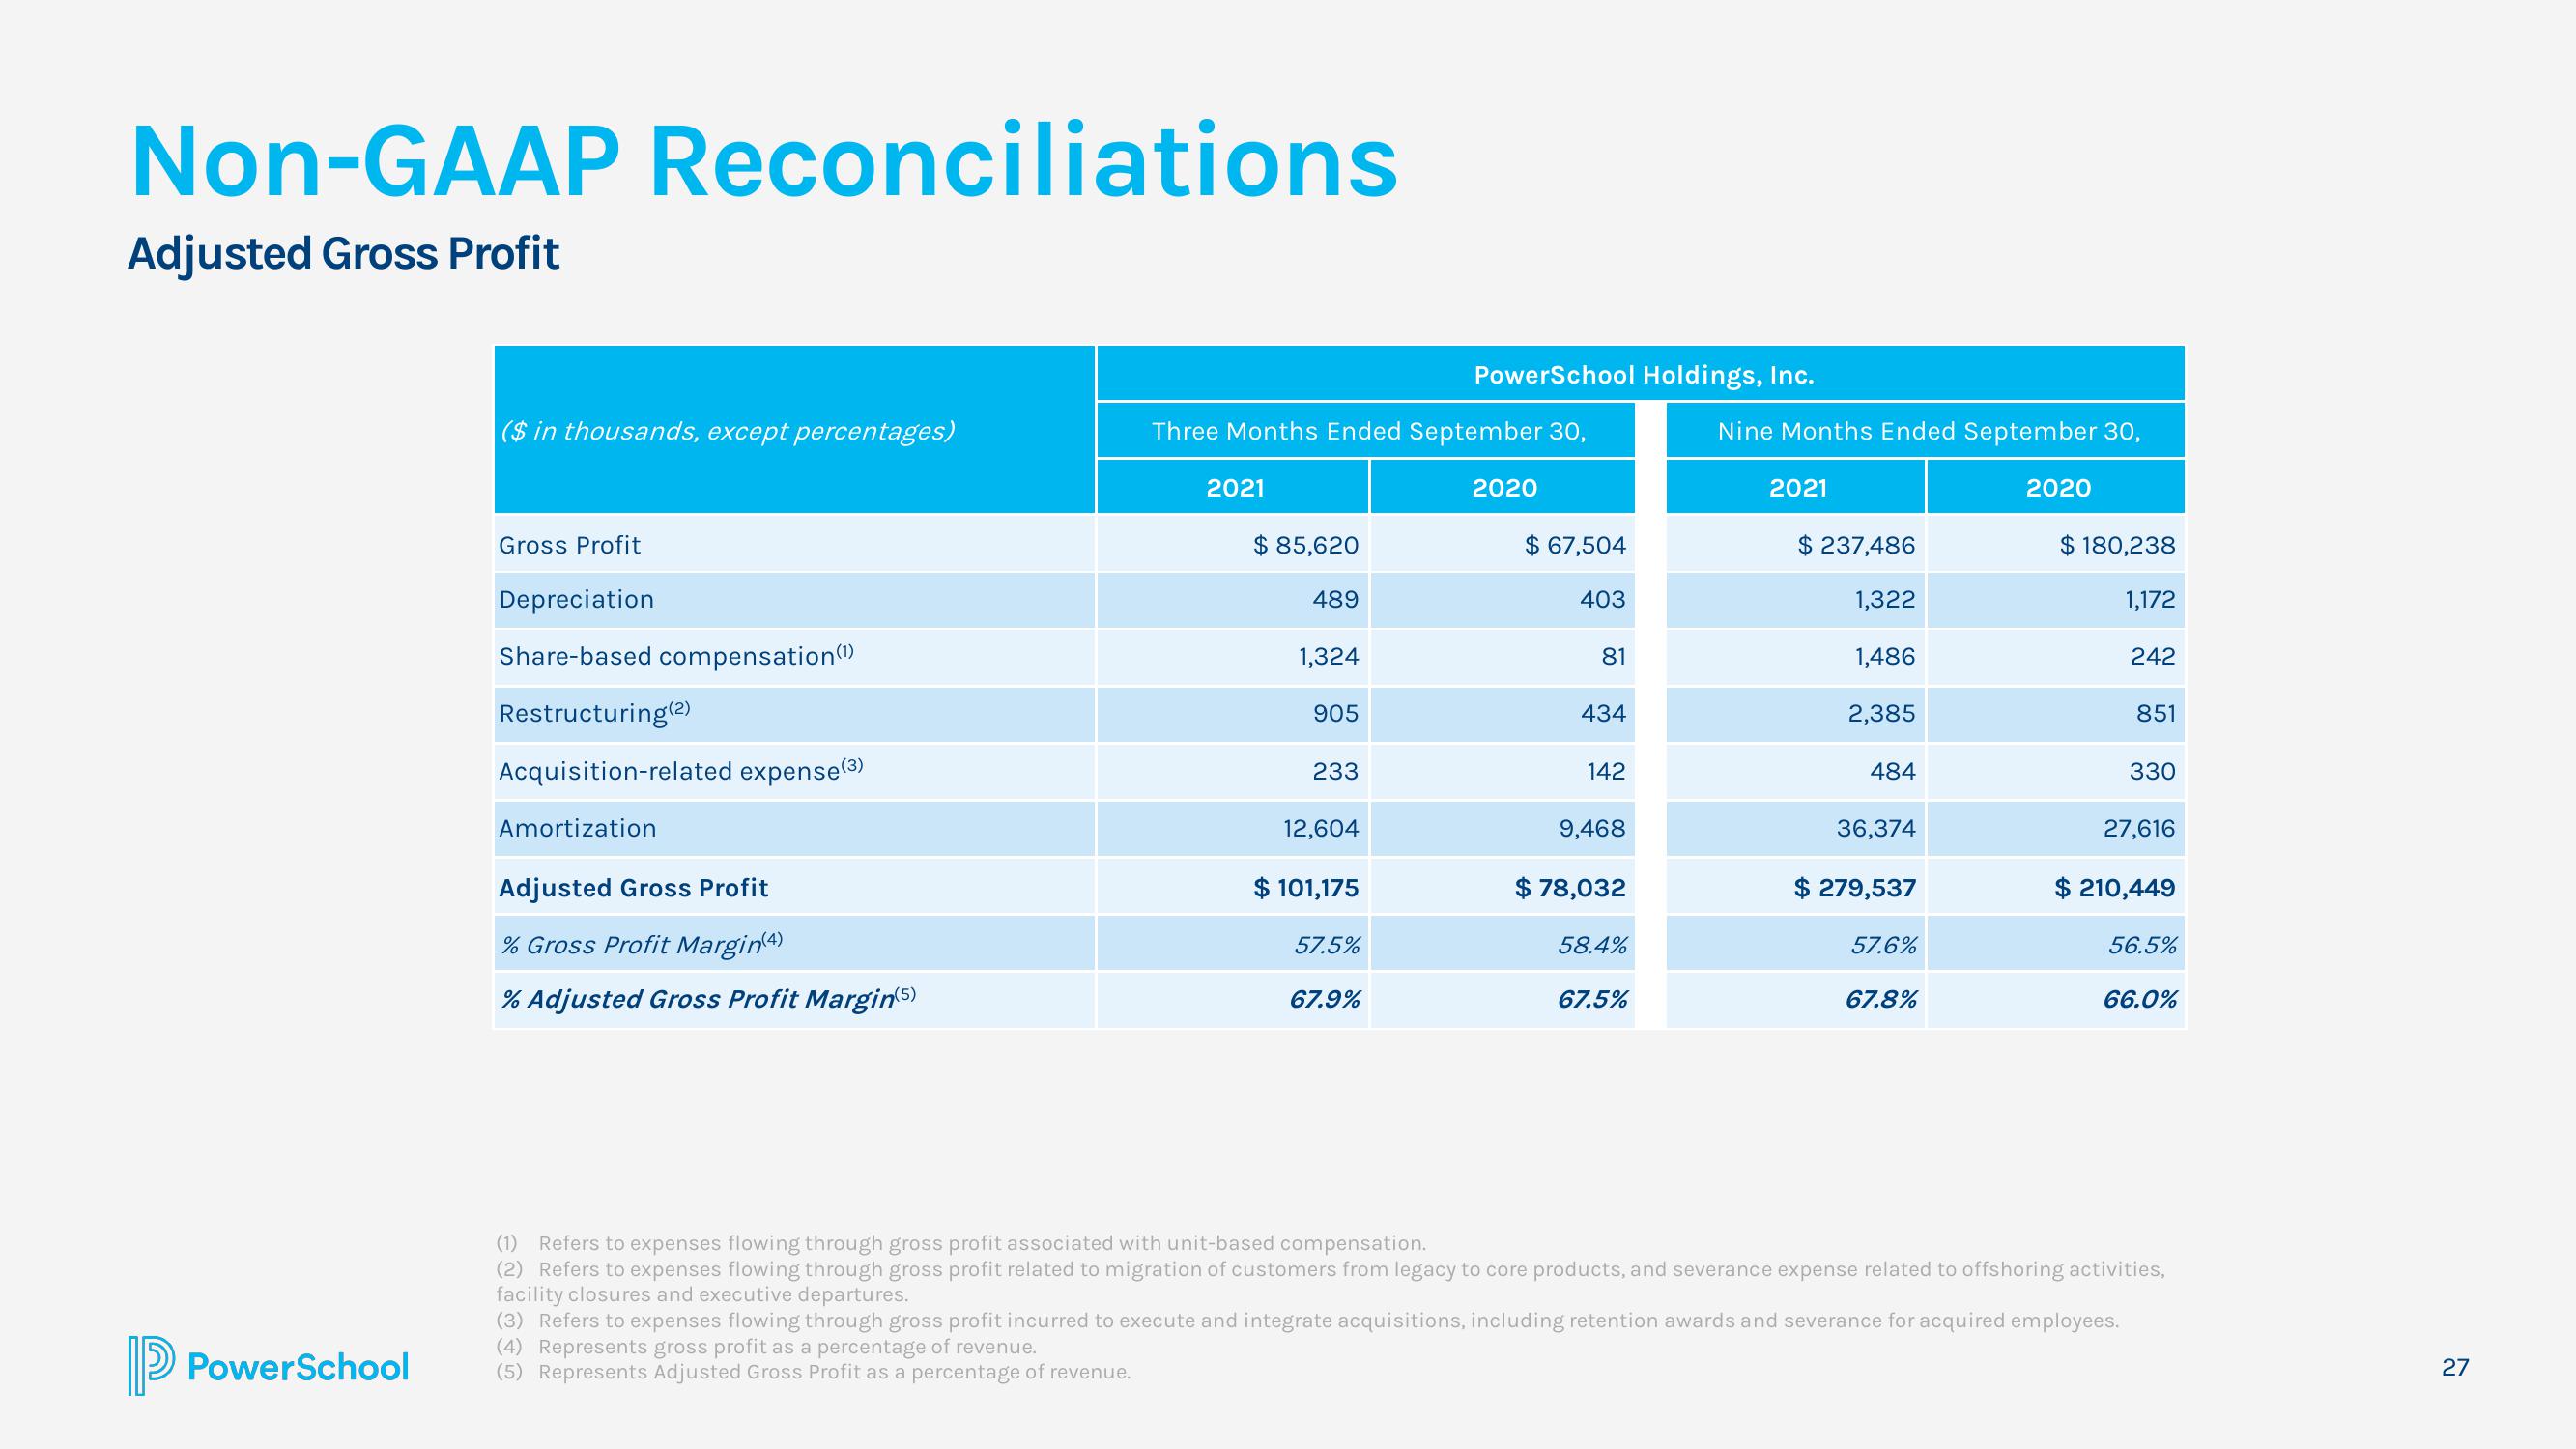
(3) Refers to expenses flowing through gross profit incurred to execute and integrate acquisitions, including retention awards and severance for acquired employees.
(4) Represents gross profit as a percentage of revenue.
(5) Represents Adjusted Gross Profit as a percentage of revenue.
56.5%
66.0%
(1) Refers to expenses flowing through gross profit associated with unit-based compensation.
(2) Refers to expenses flowing through gross profit related to migration of customers from legacy to core products, and severance expense related to offshoring activities,
facility closures and executive departures.
27View entire presentation