NuStar Energy Investor Conference Presentation Deck
NuStar
Crude Supply/Export
Our "Core of the Core" Location has Attracted Top-Tier Customers
With Activity to Support Steady Improvement in 2021 and Beyond
The quality of geological formations underlying our system attracts the strongest customers
Our creditworthy customers include majors and the most prolific E&Ps, both private and public, in the basin, as
well as large independent refiners and marketers
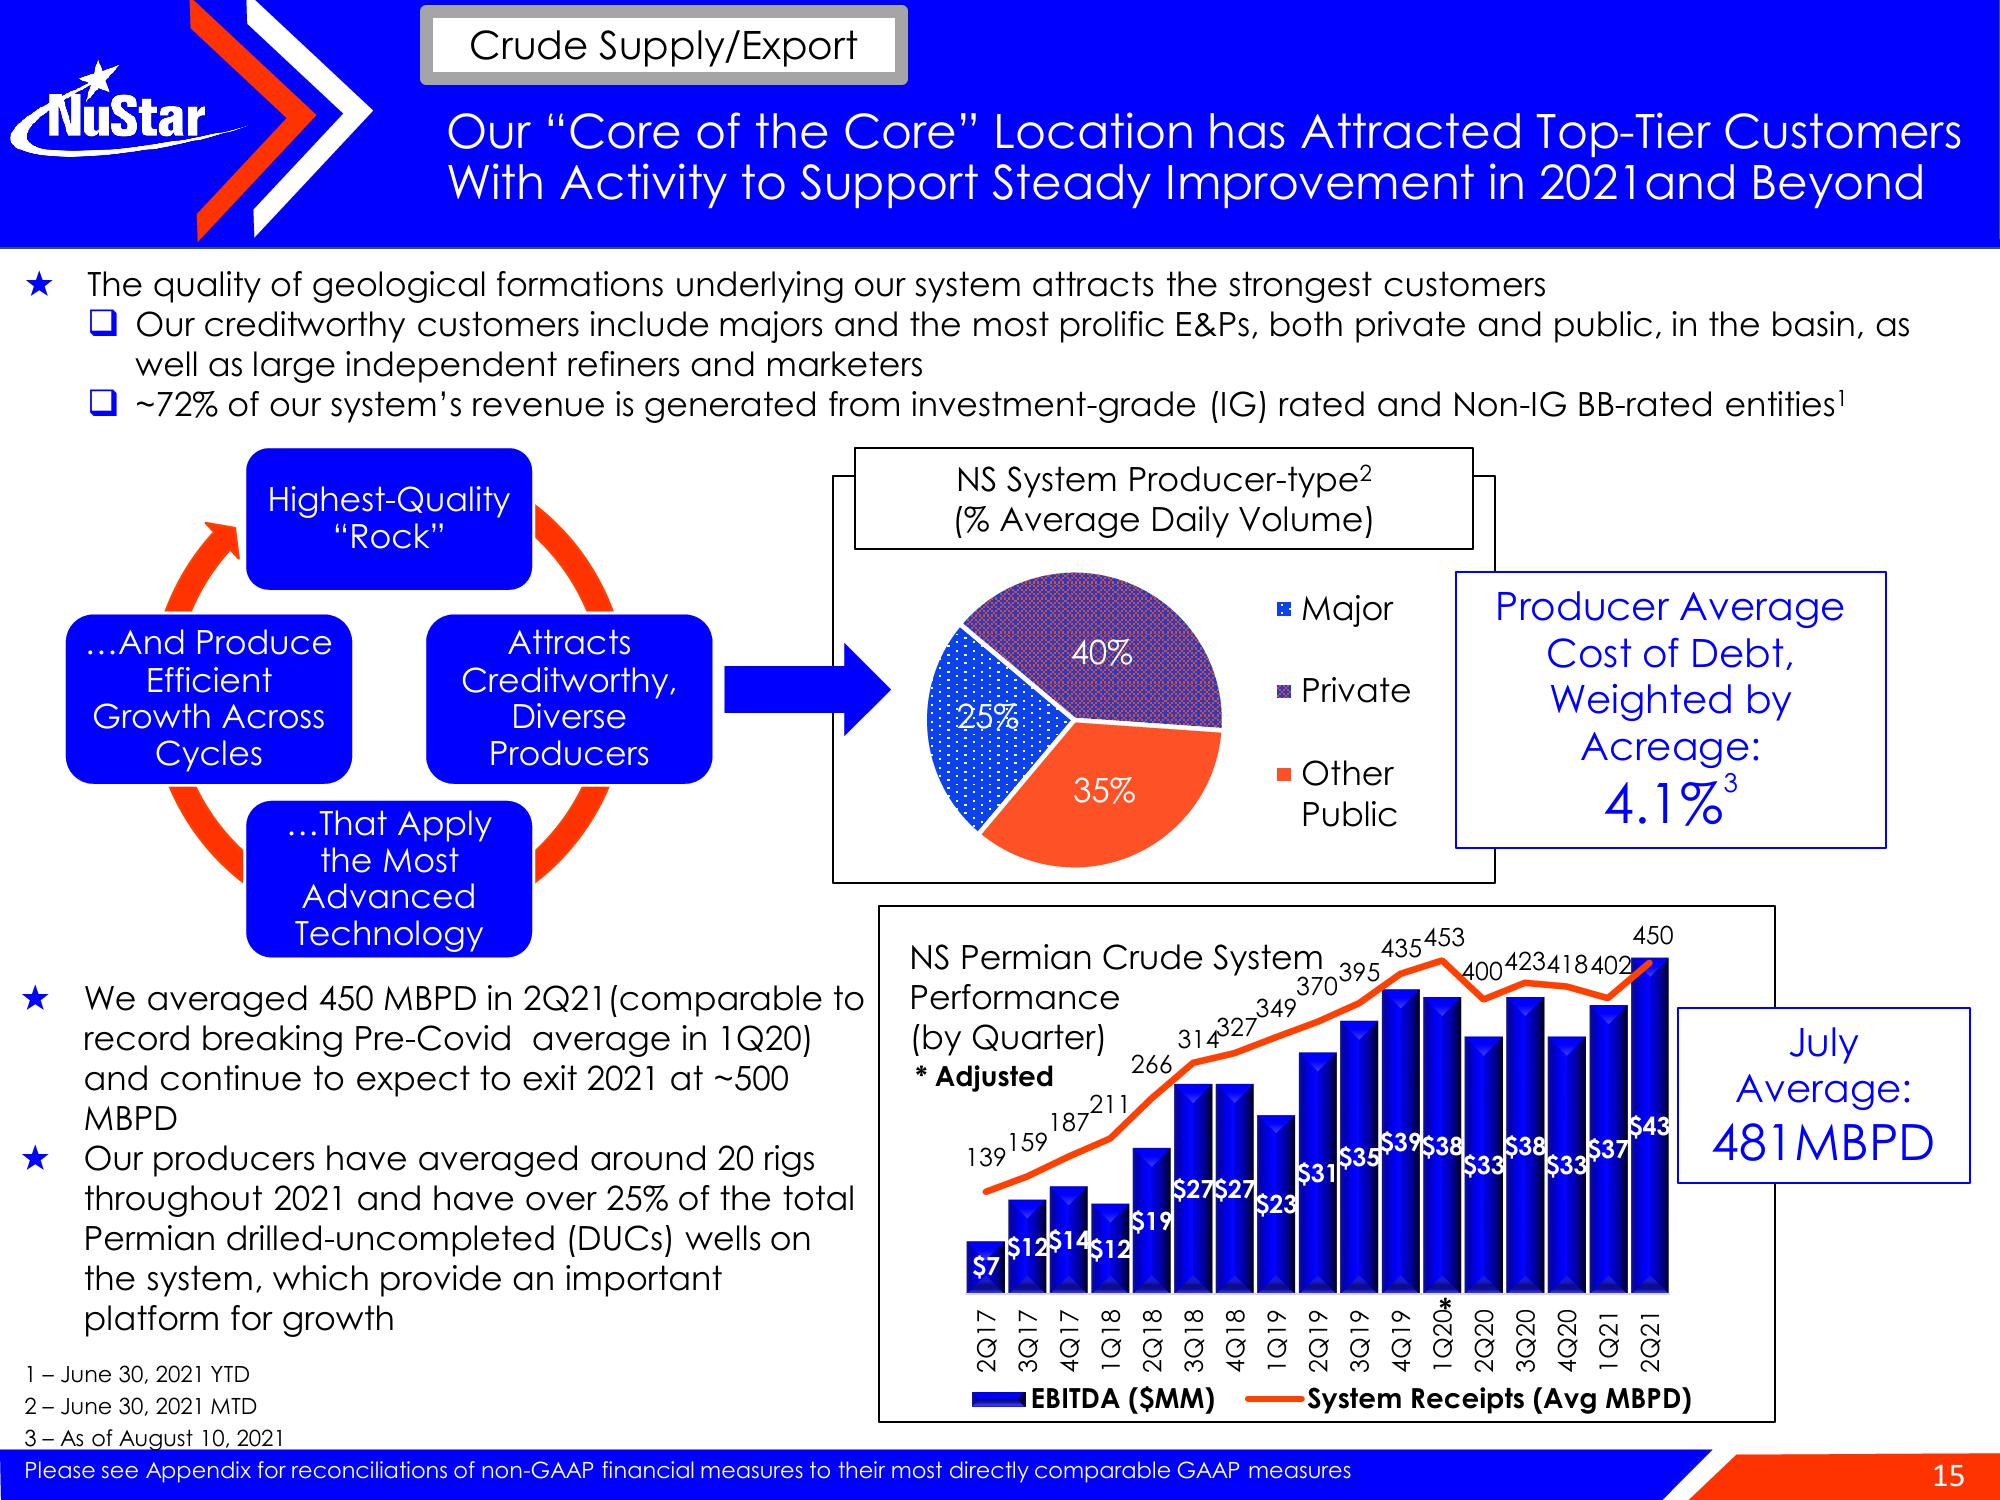
~72% of our system's revenue is generated from investment-grade (IG) rated and Non-IG BB-rated entities¹
Highest-Quality
"Rock"
...And Produce
Efficient
Growth Across
Cycles
Attracts
Creditworthy,
Diverse
Producers
...That Apply
the Most
Advanced
Technology
We averaged 450 MBPD in 2Q21 (comparable to
record breaking Pre-Covid average in 1Q20)
and continue to expect to exit 2021 at ~500
MBPD
Our producers have averaged around 20 rigs
throughout 2021 and have over 25% of the total
Permian drilled-uncompleted (DUCs) wells on
the system, which provide an important
platform for growth
NS System Producer-type²
(% Average Daily Volume)
25%
40%
$7
35%
(by Quarter)
*
*Adjusted
139159
2Q17
NS Permian Crude System
Performance
349
266
187211
314327
$12$14$12
$19
Major
■ Private
■ Other
Public
EBITDA ($MM)
$31
$27$27
$23
370395
1 - June 30, 2021 YTD
2 June 30, 2021 MTD
3- As of August 10, 2021
Please see Appendix for reconciliations of non-GAAP financial measures to their most directly comparable GAAP measures
435453
Producer Average
Cost of Debt,
Weighted by
Acreage:
3
4.1%³
400423418402
$38
$33 $33
$37
450
$43
-System Receipts (Avg MBPD)
July
Average:
481MBPD
15View entire presentation